TL;DR Modern disks are so fast that system performance bottleneck shifts to RAM access and CPU. With up to 64 cores, PCIe 4.0 and 8 memory channels, even a single-socket AMD ThreadRipper Pro workstation makes a hell of a powerful machine - if you do it right!
Update 1: Since 2021, networks have gotten faster and now it is possible to have high-speed reliable remote I/O even in cloud VMs! Here’s my recent article about testing an enterprise-grade cloud storage solution and achieving over 20GiB/s of large reads and 1.3M 8kB IOPS on the Silk Platform from a single Google Cloud VM.
Update 2: I have published another article about running (and measuring) 37M IOPS & 173 GiB/s large I/O bandwidth on a single server. I suggest you read the current article for start and then the next one!
Introduction
In this post I’ll explain how I configured my AMD ThreadRipper Pro workstation with 10 PCIe 4.0 SSDs to achieve 11M IOPS with 4kB random reads and 66 GiB/s throughput with larger IOs - and what bottlenecks & issues I fixed to get there. We’ll look into Linux block I/O internals and their interaction with modern hardware. We’ll use tools & techniques, old and new, for measuring bottlenecks - and other adventures in the kernel I/O stack.
When running fio on Linux with io_uring, the end result is this:
$ dstat -pcmrd

---procs--- ----total-usage---- ------memory-usage----- --io/total- -dsk/total-
run blk new|usr sys idl wai stl| used  free  buf   cach| read  writ| read  writ
 32   0   0| 27  73   0   0   0|2232M  249G   61M  568M|11.1M    0 |  42G    0
 33   0   0| 27  73   0   0   0|2232M  249G   61M  568M|11.1M    0 |  42G    0
 33   0   0| 27  73   0   0   0|2232M  249G   61M  568M|11.1M    0 |  42G    0
 32   0   0| 27  73   0   0   0|2232M  249G   61M  568M|11.1M    0 |  42G    0
 32   0   0| 27  73   0   0   0|2232M  249G   61M  568M|11.0M    0 |  42G    0
 32   0   0| 27  73   0   0   0|2232M  249G   61M  568M|11.0M    0 |  42G    0
 32   0   0| 28  73   0   0   0|2232M  249G   61M  568M|11.1M    0 |  42G    0
 32   0   0| 27  73   0   0   0|2232M  249G   61M  568M|11.1M    0 |  42G    0
 32   0   0| 27  72   0   0   0|2232M  249G   61M  568M|11.1M    0 |  42G    0
 32   0   0| 27  73   0   0   0|2232M  249G   61M  568M|11.1M    0 |  42G    0
With 4kB blocksize random reads, I get over 11 million IOPS, at 42 GiB/ (~45 GB/s) throughput. I will go through technical details and larger blocksizes below, but I’ll start by answering the “why” question first.
Index
- Introduction
- Why?
- Hardware
- Storage
- Single-disk test
- I/O configuration - direct I/O
- I/O configuration - I/O scheduler
- Multi-disk test
- BIOS settings
- PCIe root complex bottleneck (before)
- PCIe root complex bottleneck (after)
- Final results
- Further reading
Why?
Why would you even need such IO throughput in a single machine? Shouldn’t I be building a 50-node cluster in the cloud “for scalability”? This is exactly the point of my experiment - do you really want to have all the complexity of clusters or performance implications of remote storage if you can run your I/O heavy workload on just one server with local NVMe storage? How many databases out there need to sustain even “only” 1M disk IOPS? Or if you really do need that sweet 1 TB/s data scanning speed, you could do this with 10-20 well-configured cluster nodes instead of 200. Modern hardware is powerful, if used right!
I’m well aware of various enterprise data management functional requirements, such as availability, remote replication, data sharing or just huge data volumes that may direct you away from using local NVMe SSDs as your primary storage and I am not arguing against that. Some of these requirements can be addressed in software, some not. The scope of this article is to show the raw performance even cheap commodity hardware gives you nowadays, so if your company is paying 10x more for 100x lower throughput, it’s good to be aware of other options.
My future plans for this article series include running I/O heavy performance tests with various database engines, other ideas are welcome too!
Hardware
Machine
- Lenovo ThinkStation P620 workstation
- Tech specs are here and more details below
CPU
- AMD Ryzen Threadripper PRO 3955WX
- Zen 2 microarchitecture (7nm)
- Max number of CPU cores is 64 (128 threads), but I bought a 16-core version because I’m cheap
- All 16 cores can run at 3.9 GHz sustained base frequency, with 4.3 GHz max “boost” frequency
- This single CPU has 8 memory channels supporting 8 x DDR4 3200 ECC RDIMMs
- This CPU supports 128 PCIe 4.0 lanes
So, the excellent throughput of this workstation does not come only from CPU processing speeds, but from the additional bandwidth 8 memory channels and 128 PCIe 4.0 lanes offer! A single PCIe 4.0 lane gives you about 1.969 GB/s bandwidth in each direction (PCIe is switched, point-to-point full duplex). In theory, 128 lanes should mean that the CPU can handle ~250 GB/s (2 terabit/s!) PCIe traffic in each direction, if all lanes were fully used.
Note that on modern CPUs, most PCIe lanes are connected directly to the CPU (as are memory channels) and do not go through some external “southbridge” controller or “front-side bus”.
This also means that a single PCIe 4.0 x4 card can achieve close to 8 GB/s data transfer speed, assuming that the devices can handle it and you do not hit other bottlenecks first. This leads us to the next section, suitable SSDs.
Storage
The Samsung 980 Pro is a true PCIe 4.0 SSD, with specs claiming 7000 MB/s read and 5000 MB/s write throughput (with caveats). Its internal controller is capable of true PCIe 4.0 transfer speeds and is not an old PCIe 3.0 chip that just presents it as a PCIe 4.0 compatible one with low GT/s. I understand that some other “PCIe4” SSDs out there will max out at the PCIe3 speeds (~3.5 GB/s) as they don’t have new generation controllers in them.
I ended up buying 8 x 1 TB SSDs, eventually used for data volumes and 2 x 500 GB ones for boot disks and software. I also have a 380 GB Intel Optane 905P SSD for low latency writes (like transaction logs), but more about that in a future post.
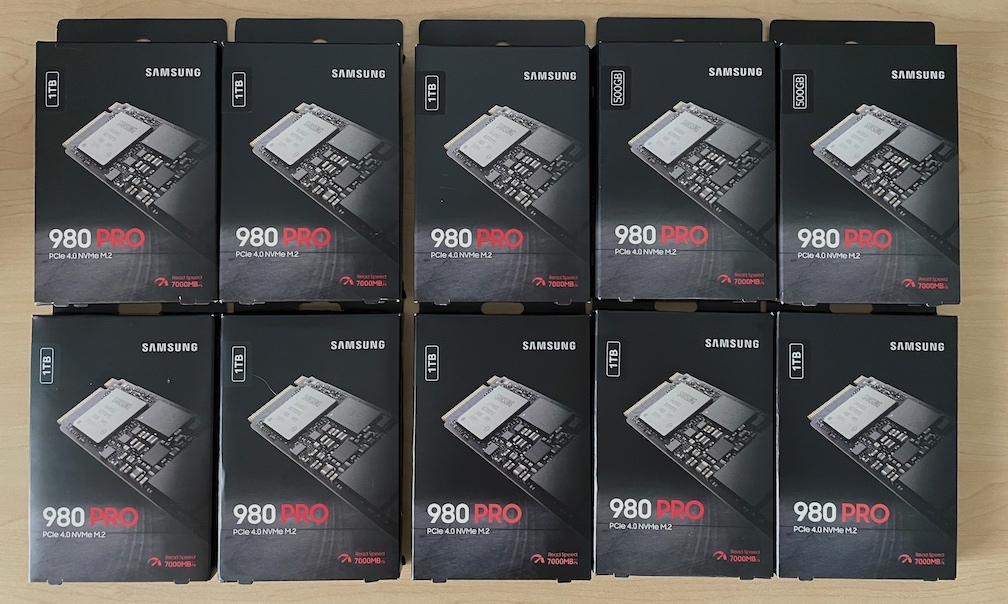
The NVMe disks show up like this (8x1 TB and 2x500 GB):
$ sudo nvme list
Node             SN                   Model
---------------- -------------------- ---------------------------
/dev/nvme0n1     S5P2NG0N902798J      Samsung SSD 980 PRO 1TB
/dev/nvme1n1     S5P2NG0NA02399T      Samsung SSD 980 PRO 1TB
/dev/nvme2n1     S5P2NG0NA04362H      Samsung SSD 980 PRO 1TB
/dev/nvme3n1     S5P2NG0N902802P      Samsung SSD 980 PRO 1TB
/dev/nvme4n1     S5P2NG0NA00551P      Samsung SSD 980 PRO 1TB
/dev/nvme5n1     S5P2NG0NA03266N      Samsung SSD 980 PRO 1TB
/dev/nvme6n1     S5P2NG0NA01498X      Samsung SSD 980 PRO 1TB
/dev/nvme7n1     S5P2NG0NA04358V      Samsung SSD 980 PRO 1TB
/dev/nvme8n1     S5NYNG0N906374T      Samsung SSD 980 PRO 500GB
/dev/nvme9n1     S5NYNG0N906379K      Samsung SSD 980 PRO 500GB
Samsung’s specs pages (1,2) state that the max sequential read & write speeds as 7000 MB/s & 5000 MB/s for the 1 TB drives using PCIe 4.0. The IO pattern doesn’t really have to be sequential, just with big enough I/O sizes. When these cards are plugged in to PCIe 3.0 slots, you’d get only ~3500 MB/s read and write speeds due to the PCIe 3.0 x4 throughput limitations.
Take the write speeds with a grain of salt, as TLC & QLC cards have slower multi-bit writes into the main NAND area, but may have some DRAM memory for buffering writes and/or a “TurboWrite buffer” (as Samsung calls it) that uses part of the SSDs NAND as faster SLC storage. It’s done by issuing single-bit “SLC-like” writes into TLC area. So, once you’ve filled up the “SLC” TurboWrite buffer at 5000 MB/s, you’ll be bottlenecked by the TLC “main area” at 2000 MB/s (on the 1 TB disks).
Apparently on the 980’s the TurboWrite buffer defaults to ~6 GB on the 1 TB SSD, but it’s dynamic and can grow up to 108 GB if there’s high write demand and enough unused NAND space. Samsung also has their own designed-in-house disk controller (Elpis) that is built for achieving PCIe 4.0 speeds. It can handle 128 I/O queues (with 64k command sets per queue!). This article is a good reference about this disk - and an overview of complexity (and potential bottlenecks) of modern SSDs!
As I want to focus on just the max raw block I/O performance for this article, I will run my tests directly against the NVMe block devices (without a filesystem or LVM on the I/O path). NVMe block devices have per-CPU multi-queues (MQ) enabled by default and device interrupts are “striped” across all CPUs. I’ll present some LVM, multiqueue and file system tests in future articles.
Single-disk test
I used fio 3.25 on Ubuntu 20.10 with Ubuntu-provided Linux kernel 5.8.0-29-generic for these tests. I briefly tested the (currently) latest Linux kernel 5.11-rc4 too, it has some io_uring enhancements, but got lower throughput out of it. There are some big AMD ThreadRipper (power-aware scheduler) updates in it, apparently with some unsolved performance regressions.
I first ran a single-disk test to avoid hitting any system-wide throughput bottlenecks when accessing all 10 SSDs simultaneously. This test aimed to give me a theoretical max throughput of a single disk. I used fio with --io_uring asynchronous I/O option. As expected, it was more efficient than libaio.
I ended up using the following fio command for my narrowly focused synthetic benchmark. I’ll explain the reasoning for some of the command line options later in this post.
Here’s the onessd.sh script that I used for single-disk testing:
#!/bin/bash

[ $# -ne 3 ] && echo Usage $0 numjobs /dev/DEVICENAME BLOCKSIZE && exit 1

fio --readonly --name=onessd \
    --filename=$2 \
    --filesize=100g --rw=randread --bs=$3 --direct=1 --overwrite=0 \
    --numjobs=$1 --iodepth=32 --time_based=1 --runtime=3600 \
    --ioengine=io_uring \
    --registerfiles --fixedbufs \
    --gtod_reduce=1 --group_reporting
Ok, let’s first run fio with 3 concurrent workers doing 4kB reads against a single disk only (with queue_depth=32 per worker), to see the maximum theoretical throughput of such a disk in my machine:
$ sudo ./onessd.sh 3 /dev/nvme0n1 4k
fio-3.25-26-gb213
Starting 3 processes
Jobs: 3 (f=3): [r(3)][0.3%][r=4489MiB/s][r=1149k IOPS][eta 59m:50s]
Looks like we got even more IOPS out of the disk than Samsung promised - their specs said “only” 1,000,000 IOPS per disk. If you wonder why I’m running the single-disk test with 3 concurrent worker processes - it turns out that a single process maxes out a single CPU at about 450k IOPS on my setup. So, a single process is physically incapable of submitting (and reaping) more than 450k I/Os per second of CPU time (being 100% on CPU). Assuming that its CPU core was running at around 3.9 GHz (and didn’t have much else to do), it translates to about 3,900,000,000 / 450,000 = 8,666 CPU cycles used for submitting + issuing + completing + reaping each I/O.
If you look into the metrics below, you see that my 3 worker processes used about 9-10% of CPU capacity of my machine with 32 (logical) processors:
$ dstat -pcrmd

---procs--- ----total-usage---- ------memory-usage----- --io/total- -dsk/total-
run blk new|usr sys idl wai stl| used  free  buf   cach| read  writ| read  writ
3.0   0   0|  2   8  91   0   0|1792M  249G   41M  406M|1145k    0 |4472M    0
3.0   0   0|  2   7  91   0   0|1793M  249G   41M  406M|1150k    0 |4493M    0
3.0   0   0|  2   8  91   0   0|1793M  249G   41M  406M|1152k    0 |4499M    0
3.0   0   0|  1   8  91   0   0|1793M  249G   41M  406M|1151k    0 |4498M    0
Sidenote: It looks like dstat on Ubuntu 20.10 has some CPU utilization rounding & reporting errors. I used other tools to verify that my CPU numbers in this article are similar.
How about large I/Os? Let’s try 1 MB sized reads, something that a database engine would be using for scanning large tables:
$ sudo ./onessd.sh 3 /dev/nvme0n1 1m
fio-3.25-26-gb213
Starting 3 processes
Jobs: 3 (f=3): [r(3)][0.2%][r=6811MiB/s][r=6811 IOPS][eta 59m:53s]
We are scanning data at over 6 GiB/s just using one disk!
Seems like we couldn’t actually do 1 MB sized reads, as we are issuing 13.8k read operations for ~6800 MB below. Either fio wasn’t able to issue 1 MB-sized IOs or the larger requests got split into ~512kB chunks somewhere in the kernel:
----total-usage---- ---procs--- ------memory-usage----- --io/total- -dsk/total-
usr sys idl wai stl|run blk new| used  free  buf   cach| read  writ| read  writ
  0   1  99   0   0|  0   0   0|1990M  249G   54M  441M|13.8k    0 |6807M    0
  0   1  99   0   0|  0   0   0|1990M  249G   54M  441M|13.7k    0 |6799M    0
  0   1  99   0   0|  0   0   0|1990M  249G   54M  441M|13.8k    0 |6805M    0
  0   1  99   0   0|  0   0   0|1990M  249G   54M  441M|13.7k    0 |6803M    0
Thanks to the big I/O sizes, every request takes a lot of time as the disk’s DMA controller copies the request’s data to relevant memory location in RAM. PCIe 4.0 x4 max theoretical transfer rate is about 7.877 GB/s, even the PCIe transfer from the disk controller memory to CPU will take over 120 us per MB, in addition to the flash reading and SSD controller’s latency.
So, as you see from the CPU usage numbers above, my CPUs were 99% idle, despite running 3 concurrent fio workers and top confirmed that. What were the worker processes doing then? They were mostly sleeping, waiting for events in io_uring completion queue, with WCHAN io_cqring_wait:
$ sudo psn -G syscall,wchan -a -p ^fio

Linux Process Snapper v0.18 by Tanel Poder [https://0x.tools]
Sampling /proc/syscall, wchan, stat for 5 seconds... finished.


=== Active Threads =============================================================================

 samples | avg_threads | comm  | state                  | syscall         | wchan
------------------------------------------------------------------------------------------------
     203 |        2.03 | (fio) | Sleep (Interruptible)  | io_uring_enter  | io_cqring_wait
     100 |        1.00 | (fio) | Sleep (Interruptible)  | select          | do_select
      85 |        0.85 | (fio) | Sleep (Interruptible)  | clock_nanosleep | hrtimer_nanosleep
      14 |        0.14 | (fio) | Disk (Uninterruptible) | openat          | __blkdev_get
      12 |        0.12 | (fio) | Running (ON CPU)       | io_uring_enter  | 0
      12 |        0.12 | (fio) | Sleep (Interruptible)  | [running]       | io_cqring_wait
       9 |        0.09 | (fio) | Running (ON CPU)       | io_uring_enter  | io_cqring_wait
       2 |        0.02 | (fio) | Running (ON CPU)       | [running]       | 0
       2 |        0.02 | (fio) | Sleep (Interruptible)  | [running]       | 0
       1 |        0.01 | (fio) | Running (ON CPU)       | futex           | futex_wait_queue_me


samples: 100 (expected: 100)
total processes: 4, threads: 5
runtime: 5.00, measure time: 0.18
You can download the open source psn tool from 0x.tools site.
I/O configuration - direct I/O
In the following two sections I show how I tried different OS level I/O configuration options (direct vs cached I/O and using an I/O scheduler). These sections go pretty deep into Linux kernel troubleshooting topics, if you want to skip this and read about the hardware configuration challenges, jump to the Multi-disk test section.
I used --direct=1 option that forces files to be opened with O_DIRECT flag - bypassing the OS pagecache. When running millions of IOPS, you want to minimize the CPU overhead of every operation and copying, searching & replacing pages in the OS pagecache will radically increase your CPU usage and memory traffic. Most mature database engines have a built-in cache anyway, so why duplicate work (and memory usage).
But for fun, I ran the same test with --direct=0 anyway and the results are below:
$ dstat -pcmrd

---procs--- ----total-usage---- ------memory-usage----- --io/total- -dsk/total-
run blk new|usr sys idl wai stl| used  free  buf   cach| read  writ| read  writ
 75   0   0|  0 100   0   0   0|1997M 1864M  244G  243M|5947     0 |2953M    0
 60 3.0   0|  0 100   0   0   0|2005M 1193M  245G  243M|7188  11.0 |3593M  244k
 56 2.0   0|  0  99   0   1   0|1993M 1363M  245G  243M|6290     0 |3143M    0
 56 1.0   0|  0  99   0   1   0|1992M 1316M  245G  240M|6545     0 |3266M    0
 38  19   0|  0  99   0   1   0|1984M 1271M  245G  237M|6493     0 |3239M    0 ^C
Wait, what? My fio test with 3 workers somehow keeps all the CPUs 100% busy in kernel mode? The runnable threads (run column) alternates between 38 and 75? The read throughput has dropped from over 6 GiB/s to 3 GiB/s. But why do we have so much CPU activity? Is that just how it is?
Let’s not guess or give up, but measure! As the kernel CPU usage is very high, we have a couple of options for drilling down.
pSnapper can show which threads (and in which state) are most active:
$ sudo psn -G syscall,wchan

Linux Process Snapper v0.18 by Tanel Poder [https://0x.tools]
Sampling /proc/syscall, wchan, stat for 5 seconds... finished.


=== Active Threads ================================================================================================

 samples | avg_threads | comm                 | state                  | syscall         | wchan
-------------------------------------------------------------------------------------------------------------------
    4218 |       59.41 | (io_wqe_worker-*)    | Disk (Uninterruptible) | [kernel_thread] | wait_on_page_bit_common
    1698 |       23.92 | (io_wqe_worker-*)    | Running (ON CPU)       | [running]       | 0
      54 |        0.76 | (fio)                | Running (ON CPU)       | [running]       | 0
      18 |        0.25 | (kswapd*)            | Running (ON CPU)       | [running]       | 0
       8 |        0.11 | (io_wqe_worker-*)    | Running (ON CPU)       | [kernel_thread] | 0
       5 |        0.07 | (io_wqe_worker-*)    | Disk (Uninterruptible) | [running]       | 0
       5 |        0.07 | (io_wqe_worker-*)    | Disk (Uninterruptible) | [running]       | wait_on_page_bit_common
       5 |        0.07 | (kworker/*:*-events) | Running (ON CPU)       | [running]       | 0
       4 |        0.06 | (fio)                | Running (ON CPU)       | io_uring_enter  | io_cqring_wait
       4 |        0.06 | (io_wqe_worker-*)    | Running (ON CPU)       | [kernel_thread] | wait_on_page_bit_common
       1 |        0.01 | (fio)                | Running (ON CPU)       | io_uring_enter  | 0
       1 |        0.01 | (io_wqe_worker-*)    | Running (ON CPU)       | [kernel_thread] | io_wqe_worker
       1 |        0.01 | (rcu_sched)          | Running (ON CPU)       | [running]       | 0
So, it’s not my 3 fio processes that magically eat all the CPU time, but there’s a lot of io_wge_worker-N kernel threads that are doing something! It starting to look like “it’s not me, it’s you - Linux kernel”. When you scroll the above output right, you see that the top entry reports these threads waiting in thread state D - uninterruptible (usually) disk I/O sleep and the kernel function (wchan) that requested the sleep is wait_on_page_bit_common. That’s the common WCHAN that shows up whenever you’re waiting in cached I/O (pagecache) codepath. We still don’t know whether this is just a “waiting for slow I/O via pagecache to complete” scenario or some kernel issue. Remember that there’s a significant amount of these kernel worker threads also burning CPU in kernel mode, not waiting for anything (the 2nd highlighted line with “Running (ON CPU)” above).
The good news is that we can easily drill down further! pSnapper allows you to sample /proc/PID/stack too to get a rough idea of in which kernel locations any of your threads are. You will have to scroll all the way to the right, until you see the highlighted functions:
$ sudo psn -G syscall,wchan,kstack

Linux Process Snapper v0.18 by Tanel Poder [https://0x.tools]
Sampling /proc/syscall, stack, wchan, stat for 5 seconds... finished.


=== Active Threads =======================================================================================================================================================================================================================================================================================================================================================================================================================================================================================================================================================================================================================

 samples | avg_threads | comm                 | state                  | syscall         | wchan                   | kstack
------------------------------------------------------------------------------------------------------------------------------------------------------------------------------------------------------------------------------------------------------------------------------------------------------------------------------------------------------------------------------------------------------------------------------------------------------------------------------------------------------------------------------------------------------------------------------------------------------------------------------------------
     686 |       19.06 | (io_wqe_worker-*)    | Running (ON CPU)       | [running]       | 0                       | -
     418 |       11.61 | (io_wqe_worker-*)    | Disk (Uninterruptible) | [kernel_thread] | wait_on_page_bit_common | kthread()->io_wqe_worker()->io_worker_handle_work()->io_wq_submit_work()->io_issue_sqe()->io_read()->blkdev_read_iter()->generic_file_read_iter()->generic_file_buffered_read()->wait_on_page_bit_common()
     384 |       10.67 | (io_wqe_worker-*)    | Running (ON CPU)       | [running]       | 0                       | kthread()->io_wqe_worker()->io_worker_handle_work()->io_wq_submit_work()->io_issue_sqe()->io_read()->blkdev_read_iter()->generic_file_read_iter()->generic_file_buffered_read()->wait_on_page_bit_common()
     284 |        7.89 | (io_wqe_worker-*)    | Running (ON CPU)       | [running]       | 0                       | kthread()->io_wqe_worker()->io_worker_handle_work()->io_wq_submit_work()->io_issue_sqe()->io_read()->blkdev_read_iter()->generic_file_read_iter()->generic_file_buffered_read()->page_cache_sync_readahead()->force_page_cache_readahead()->page_cache_readahead_unbounded()->__page_cache_alloc()->alloc_pages_current()->__alloc_pages_nodemask()->__alloc_pages_slowpath.constprop.0()->try_to_free_pages()->do_try_to_free_pages()->shrink_zones()->shrink_node()->shrink_node_memcgs()->shrink_lruvec()->shrink
     233 |        6.47 | (io_wqe_worker-*)    | Running (ON CPU)       | [running]       | 0                       | kthread()->io_wqe_worker()->io_worker_handle_work()->io_wq_submit_work()->io_issue_sqe()->io_read()->blkdev_read_iter()->generic_file_read_iter()->generic_file_buffered_read()->page_cache_sync_readahead()->force_page_cache_readahead()->page_cache_readahead_unbounded()->__page_cache_alloc()->alloc_pages_current()->__alloc_pages_nodemask()->__alloc_pages_slowpath.constprop.0()->try_to_free_pages()->do_try_to_free_pages()->shrink_zones()->shrink_node()->shrink_node_memcgs()->shrink_lruvec()->shrink
      47 |        1.31 | (io_wqe_worker-*)    | Running (ON CPU)       | [running]       | 0                       | kthread()->io_wqe_worker()->io_worker_handle_work()->io_wq_submit_work()->io_issue_sqe()->io_read()->blkdev_read_iter()->generic_file_read_iter()->generic_file_buffered_read()->page_cache_sync_readahead()->force_page_cache_readahead()->page_cache_readahead_unbounded()->add_to_page_cache_lru()->__add_to_page_cache_locked()->mem_cgroup_charge()->mem_cgroup_charge_statistics.constprop.0()
      34 |        0.94 | (fio)                | Running (ON CPU)       | [running]       | 0                       | __x64_sys_io_uring_enter()->__do_sys_io_uring_enter()->io_cqring_wait()
      34 |        0.94 | (io_wqe_worker-*)    | Running (ON CPU)       | [running]       | 0                       | kthread()->io_wqe_worker()->io_worker_handle_work()->io_wq_submit_work()->io_issue_sqe()->io_read()->blkdev_read_iter()->generic_file_read_iter()->generic_file_buffered_read()->page_cache_sync_readahead()->force_page_cache_readahead()->page_cache_readahead_unbounded()->__page_cache_alloc()->alloc_pages_current()->__alloc_pages_nodemask()
      22 |        0.61 | (kswapd*)            | Running (ON CPU)       | [running]       | 0                       | kthread()->kswapd()->balance_pgdat()->shrink_node()->shrink_node_memcgs()->shrink_lruvec()->shrink_inactive_list()->shrink_page_list()->__remove_mapping()->native_queued_spin_lock_slowpath()
      11 |        0.31 | (io_wqe_worker-*)    | Running (ON CPU)       | [kernel_thread] | 0                       | kthread()->io_wqe_worker()->io_worker_handle_work()->io_wq_submit_work()->io_issue_sqe()->io_read()->blkdev_read_iter()->generic_file_read_iter()->generic_file_buffered_read()->wait_on_page_bit_common()
      11 |        0.31 | (io_wqe_worker-*)    | Running (ON CPU)       | [running]       | 0                       | kthread()->io_wqe_worker()->io_worker_handle_work()->io_wq_submit_work()->io_issue_sqe()->io_read()->blkdev_read_iter()->generic_file_read_iter()->generic_file_buffered_read()->page_cache_sync_readahead()->force_page_cache_readahead()->page_cache_readahead_unbounded()->__page_cache_alloc()->alloc_pages_current()->__alloc_pages_nodemask()->__alloc_pages_slowpath.constprop.0()
Or, if you don’t like to read ultra-wide outputs, you can just use a sed trick to replace the -> with \n in pSnapper stack prints. I usually use my terminal to highlight the normal output lines of pSnapper, so I can easily spot where in the output a stack trace ends and the next thread entry starts:
$ sudo psn -G syscall,wchan,kstack | sed 's/->/\n/g'

Linux Process Snapper v0.18 by Tanel Poder [https://0x.tools]
Sampling /proc/syscall, stack, wchan, stat for 5 seconds... finished.


=== Active Threads ===============================================================================================================

 samples | avg_threads | comm                 | state                  | syscall         | wchan                   | kstack
----------------------------------------------------------------------------------------------------------------------------------
     726 |       18.15 | (io_wqe_worker-*)    | Running (ON CPU)       | [running]       | 0                       | -
     516 |       12.90 | (io_wqe_worker-*)    | Running (ON CPU)       | [running]       | 0                       | kthread()
io_wqe_worker()
io_worker_handle_work()
io_wq_submit_work()
io_issue_sqe()
io_read()
blkdev_read_iter()
generic_file_read_iter()
generic_file_buffered_read()
wait_on_page_bit_common()
     375 |        9.38 | (io_wqe_worker-*)    | Running (ON CPU)       | [running]       | 0                       | kthread()
io_wqe_worker()
io_worker_handle_work()
io_wq_submit_work()
io_issue_sqe()
io_read()
blkdev_read_iter()
generic_file_read_iter()
generic_file_buffered_read()
page_cache_sync_readahead()
force_page_cache_readahead()
page_cache_readahead_unbounded()
__page_cache_alloc()
alloc_pages_current()
__alloc_pages_nodemask()
__alloc_pages_slowpath.constprop.0()
try_to_free_pages()
do_try_to_free_pages()
shrink_zones()
shrink_node()
shrink_node_memcgs()
shrink_lruvec()
shrink
I showed the output of just 3 top pSnapper entries, but you see there’s a bunch of page-cache read-ahead happening! And worker threads are searching for free pages for this read-ahead. And to find enough free pages, they’ve had to resort to shrinking - throwing away existing pages using the pagecache LRU. And judging from the earlier CPU utilization and “runnable tasks” numbers, there are tens of threads, trying to do the same things at the same time.
Could the high CPU usage be explained by some sort of contention in the Linux kernel?
Let’s not guess - let’s measure!
I have 0x.tools enabled in my machines and among other things, run_xcpu.sh runs perf record at 1 Hz frequency. It’s always on and has unnoticeable overhead as it samples on-CPU thread stacks infrequently (I built 0x.tools for always-on low frequency profiling of production systems).
The CPU stack capture tool creates a separate output file for every minute, so I’ll pick the latest:
$ ls -lt xcap/xcpu* | head
-rw------- 1 root root  522984 Jan 27 12:26 xcap/xcpu
-rw------- 1 root root 1069888 Jan 27 12:26 xcap/xcpu.2021012712265851
-rw------- 1 root root 1502960 Jan 27 12:25 xcap/xcpu.2021012712255829
-rw------- 1 root root  536472 Jan 27 01:13 xcap/xcpu.2021012701133387
-rw------- 1 root root  537600 Jan 27 01:13 xcap/xcpu.2021012701131716
-rw------- 1 root root  702856 Jan 27 01:12 xcap/xcpu.2021012701121705
-rw------- 1 root root 1034184 Jan 27 01:11 xcap/xcpu.2021012701111678
-rw------- 1 root root 1030944 Jan 27 01:10 xcap/xcpu.2021012701101654
-rw------- 1 root root 1030960 Jan 27 01:09 xcap/xcpu.2021012701091640
-rw------- 1 root root 1033800 Jan 27 01:08 xcap/xcpu.2021012701081614

$ sudo perf report -i xcap/xcpu.2021012712265851
Here’s the output:
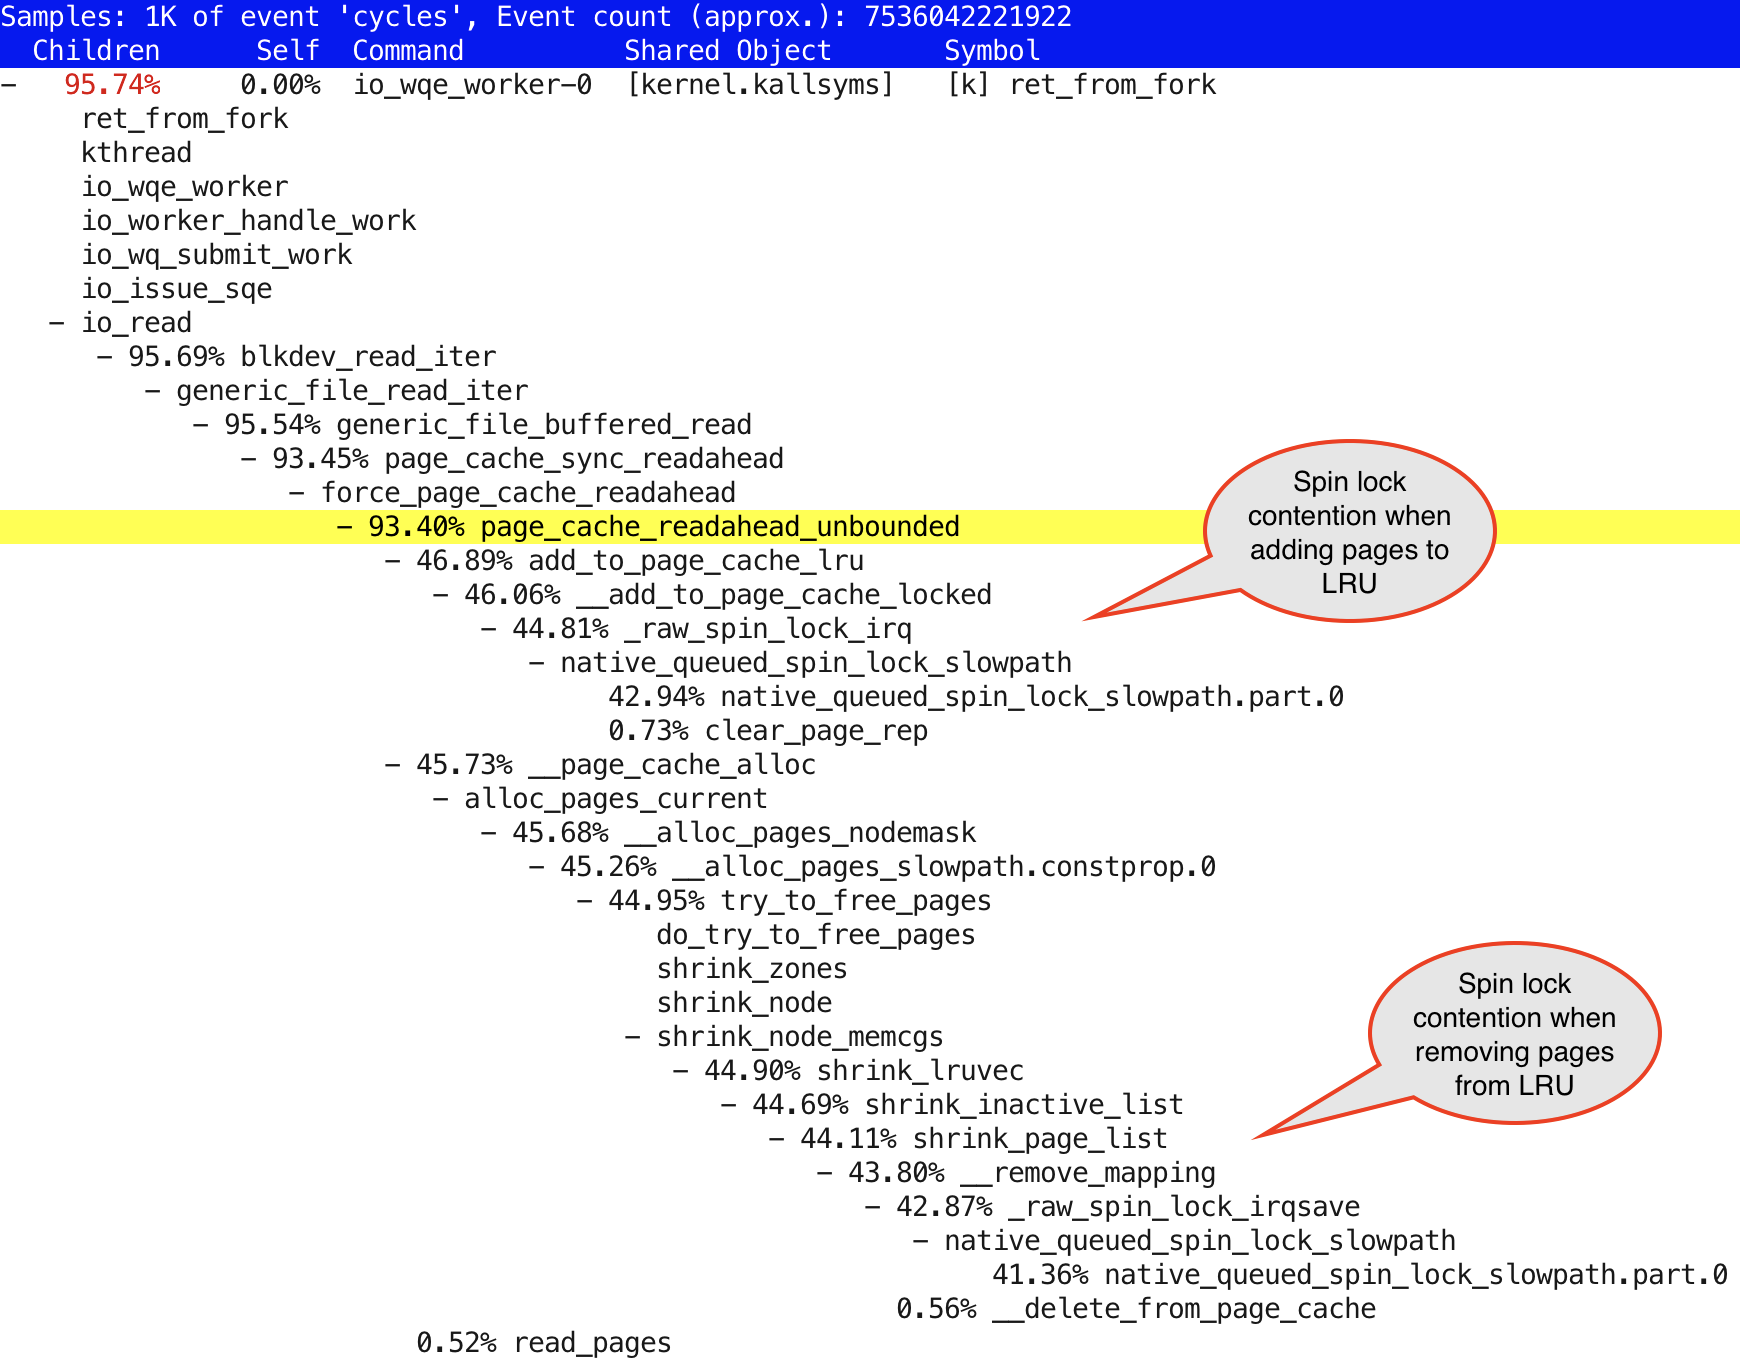
What’s the best solution for reducing spinlock contention? Use it less!
Since I don’t want to do less I/O, on the contrary, I want to push the system to do more of it - let’s just disable the readahead and see if it makes anything better. fio has a --fadvise_hint=random hint to tell the OS it expects to be doing random I/O. This didn’t seem to make a difference in my brief tests, so I just moved on and used the other option - I disabled the readahead at block device level:
$ sudo hdparm /dev/nvme0n1

/dev/nvme0n1:
 HDIO_DRIVE_CMD(identify) failed: Inappropriate ioctl for device
 readonly      =  0 (off)
 readahead     = 256 (on)
 HDIO_DRIVE_CMD(identify) failed: Inappropriate ioctl for device
 geometry      = 953869/64/32, sectors = 1953525168, start = 0
Ok, readahead is enabled, let’s turn it off for this device:
$ sudo hdparm -a 0 /dev/nvme0n1

/dev/nvme0n1:
 setting fs readahead to 0
 readahead     =  0 (off)
And now let’s run the onessd.sh benchmark again, with the same command as earlier:
$ sudo ./onessd.sh 3 /dev/nvme0n1 1m
At first, it looked like a small success, without readahead we were doing 4000+ MiB/s instead of ~3200 MiB/s and so.
But…
---procs--- ----total-usage---- ------memory-usage----- --io/total- -dsk/total-
run blk new|usr sys idl wai stl| used  free  buf   cach| read  writ| read  writ
 18  80   0|  0  21   0  69   0|2025M   47G  197G  249M|1027k    0 |4011M    0
 13  82   0|  0  20   0  69   0|2024M   43G  201G  248M|1026k    0 |4009M    0
 14  83   0|  0  21   0  69   0|2024M   39G  205G  249M|1028k 54.0 |4016M  252k
 15  79   0|  0  21   0  69   0|2024M   35G  209G  249M|1027k    0 |4010M    0
 15  81   0|  0  20   0  69   0|2025M   31G  213G  248M|1027k    0 |4011M    0

... about 60 seconds of similar output removed ...

 40  51   0|  0  69   0  27   0|2002M 1341M  241G  248M| 766k 14.0 |2993M  692k
 65  22   0|  0  75   0  21   0|2021M 1100M  241G  245M| 689k    0 |2692M    0
 19  67   0|  0  92   0   7   0|2002M 1168M  241G  244M| 653k    0 |2550M    0
 21  76   0|  0  88   0  10   0|2001M 1140M  241G  243M| 663k 2.00 |2591M   12k
 44  39   0|  0  86   0  11   0|2008M 1273M  241G  246M| 639k    0 |2496M    0
… after running for ~30-35 seconds, the throughput dropped to 3000+ MiB/s again and kernel-mode CPU usage increased too. The perf CPU profile was following:
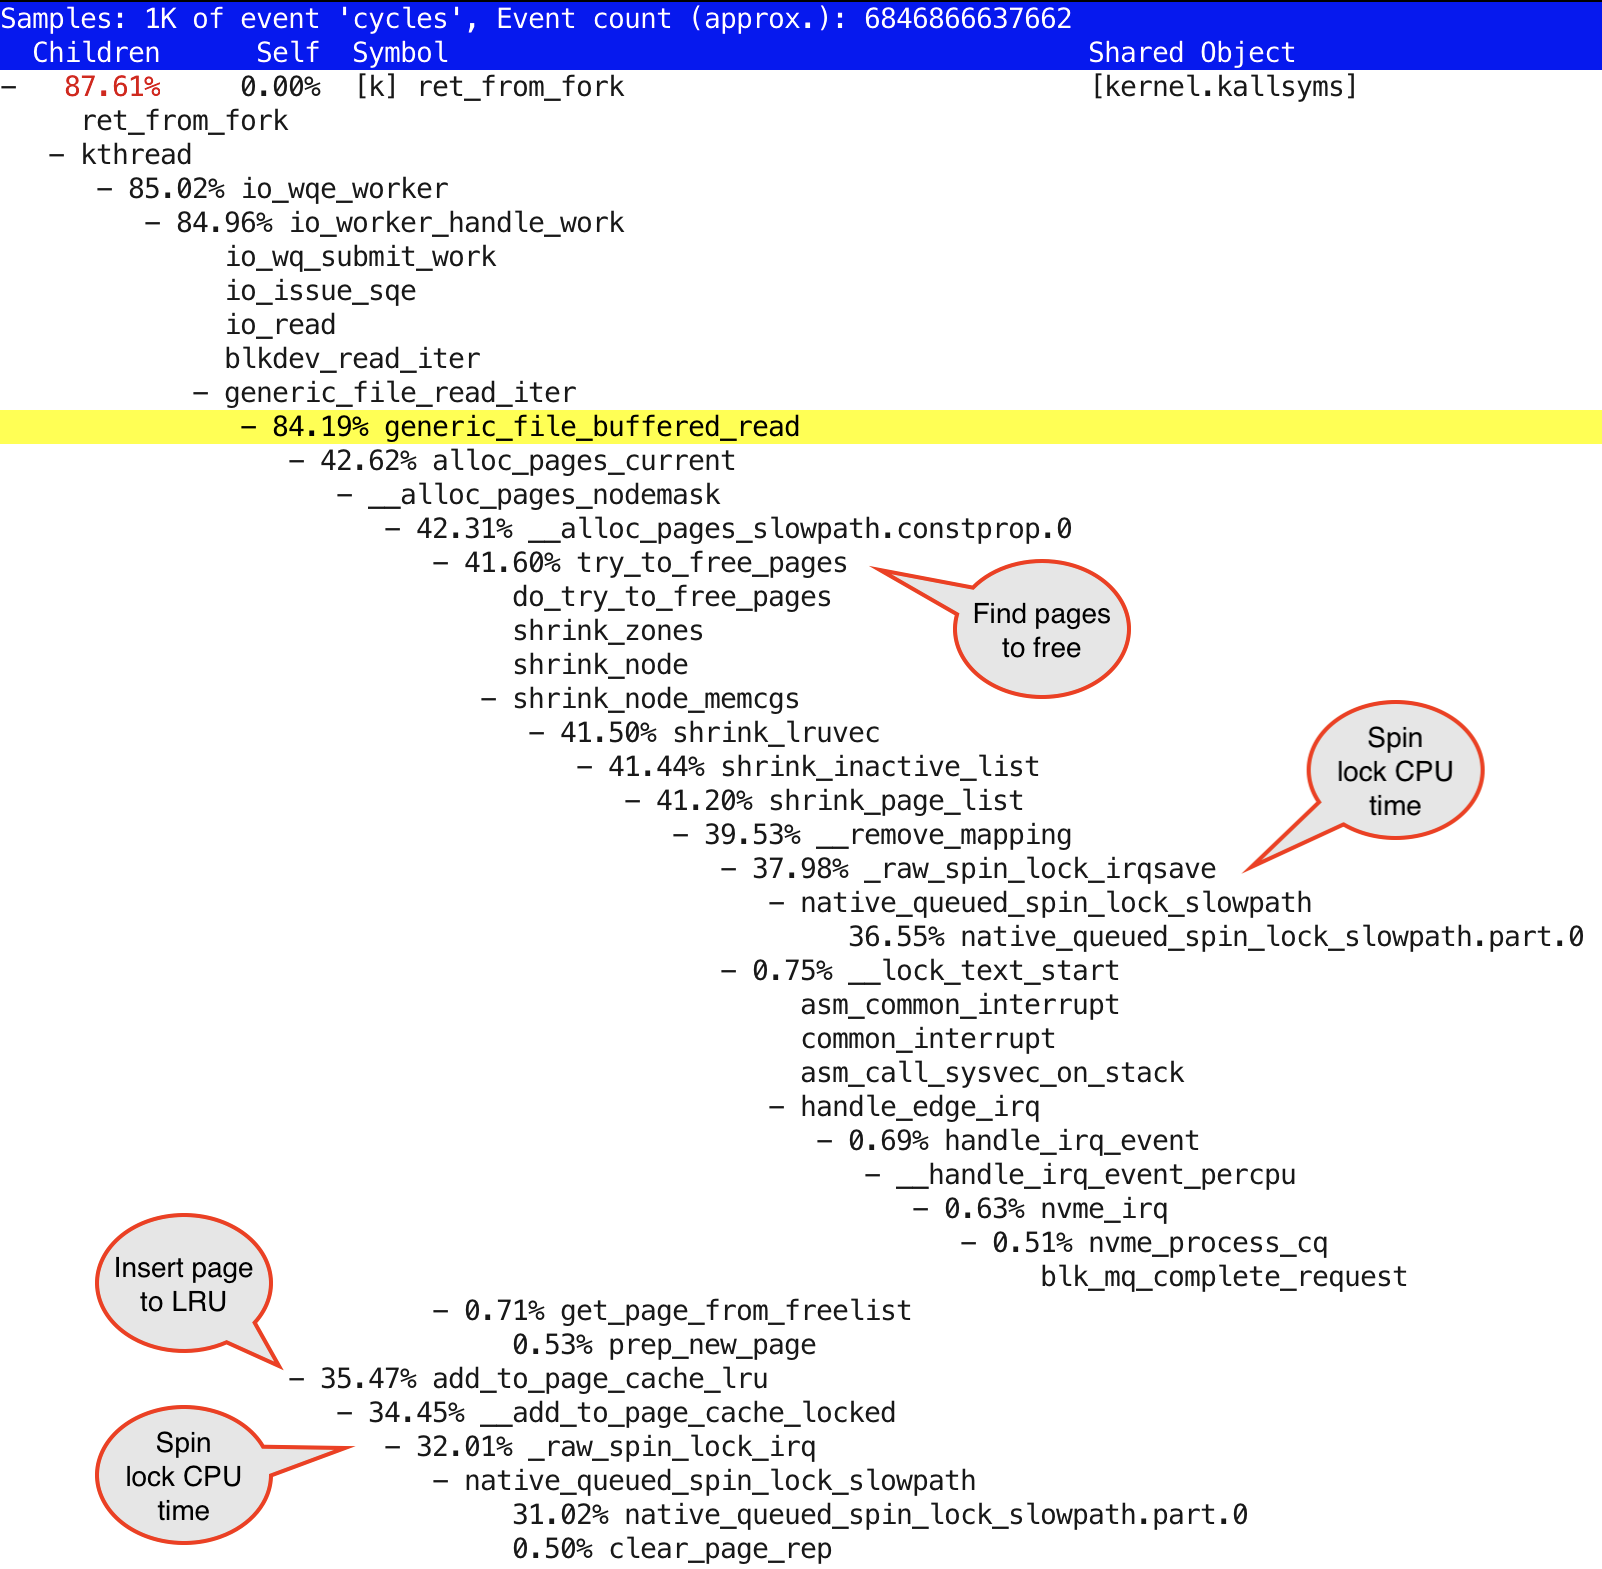
I highlighted a few items in the above screenshot with “talk bubbles”. If you compare the CPU time consumed by _raw_spinlock_irq function vs. their parents/grandparents handling cached reads or LRU operations, you’ll see that the majority of time is spent in spinlock spinning and not the actual LRU/cached read function code. One question to ask would be, why are there so many worker threads, trying to concurrently work on my 16 core/32 thread machine and ending up with a spin storm. I have only 3 fio processes accessing just one disk. With less concurrency, we’d get less spinlock contention on these pagecache LRU structures (hint: when bypassing pagecache using direct I/O, these threads won’t show up at all).
Even though the previously seen page_cache_readahead functions do not show up in kernel stack traces, we still see similar pagecache LRU replacement activity and spinlock contention. It makes sense as even without read-ahead, fio is still issuing IOs as fast as it can. My hypothesis that the readahead functions (that clearly showed up in the perf profile) had something to do with this problem, was wrong. In fact, I went back to my previous test (with read-ahead enabled) and indeed, at first I got 6800+ MiB/s scan rates - they only dropped to 3000-something after a while!
I had missed this detail at first. Even with buffered I/O mode, I got the full throughput out of the single disk (at a fairly high CPU overhead), but after a while the throughput dropped 2x, CPU usage jumped up 3-4x - and the page replacement related spinlock contention showed up in the stack. Incidentally, I have 256 GB of RAM in this machine that is not used for anything else and reading a disk for ~35 seconds at 6800 MiB gets close to 256 GB (of my RAM). And similarly, with readahead disabled, it took about 55-60 seconds at 4000 MiB/s (close to 256 GB of data read), until the pagecache LRU spinlock problem kicked in. Maybe a coincidence, but it was consistently reproducible - more research needed.
This is a good example of sudden spinlock contention showing up due to a behavior change somewhere higher in the code-path or state change in some underlying data structure, that in turn causes a behavior change. It is a feasible hypothesis that as long as there are enough unused pages in VM freelists or in the inactive area of the pagecache, kernel does not have to scan and discard pages from the LRU list, thus only allocating new pages require using spinlocks. But once you’ve exhausted the available memory (and inactive “cold” pages in the LRU), then every thread has to first search, discard pages from the LRU list, before adding them back as needed. This will suddenly cause a huge kernel CPU usage spike, even though “nothing has changed”.
There are various tracing options and /proc/vmstat metrics that would help us to drill down further, but I won’t do it here for keeping this article “short”. Remember, all this CPU usage and spinning problem happens only when using reads via OS pagecache (fio --direct=0) and we’ll go back to using direct I/O in next steps.
If you want to avoid disk I/O, use the built-in cache in your database engines and applications. If they don’t have purpose-built caches, then use OS pagecache, if you expect it to be able to hold your “working set” of hot, frequently accessed data. But if you want to do efficient disk I/O, use direct I/O via whatever application configuration settings that use the O_DIRECT flag on file open.
IO configuration - IO scheduler
Here’s another example of many things that may reduce your performance when doing millions of IOPS (or even only 100k) - I/O scheduler. This feature trades CPU time for hopefully better contained I/O latency for spinning disks. Every I/O request submission and handling will have extra CPU overhead, requests get inserted into sorted queues, timestamps are checked, hashes are computed, etc. When doing thousands of IOPS, you might not even notice any CPU overhead and on “dumb” spinning disks the investment will likely pay off.
For NVME SSDs, the I/O scheduler is disabled by default - good! If you have uniform access latency regardless of data location (like SSDs provide) or a storage array/controller with large enough queue depth, so that I/Os can be rearranged & scheduled at the storage layer, you won’t need I/O scheduling at the host level anyway. But at high IOPS rates, the CPU overhead will be noticeable, with no I/O benefit.
Let’s test this anyway! The I/O scheduler is currently none for all my SSDs:
$ grep . /sys/class/block/nvme*n1/queue/scheduler
/sys/class/block/nvme0n1/queue/scheduler:[none] mq-deadline
/sys/class/block/nvme1n1/queue/scheduler:[none] mq-deadline
/sys/class/block/nvme2n1/queue/scheduler:[none] mq-deadline
/sys/class/block/nvme3n1/queue/scheduler:[none] mq-deadline
/sys/class/block/nvme4n1/queue/scheduler:[none] mq-deadline
/sys/class/block/nvme5n1/queue/scheduler:[none] mq-deadline
/sys/class/block/nvme6n1/queue/scheduler:[none] mq-deadline
/sys/class/block/nvme7n1/queue/scheduler:[none] mq-deadline
/sys/class/block/nvme8n1/queue/scheduler:[none] mq-deadline
/sys/class/block/nvme9n1/queue/scheduler:[none] mq-deadline
Let’s enable the mq-deadline (Multi-Queue deadline) scheduling option for my test disk:
$ echo mq-deadline | sudo tee -a /sys/class/block/nvme0n1/queue/scheduler
mq-deadline

$ grep . /sys/class/block/nvme*n1/queue/scheduler
/sys/class/block/nvme0n1/queue/scheduler:[mq-deadline] none
/sys/class/block/nvme1n1/queue/scheduler:[none] mq-deadline
/sys/class/block/nvme2n1/queue/scheduler:[none] mq-deadline
/sys/class/block/nvme3n1/queue/scheduler:[none] mq-deadline
/sys/class/block/nvme4n1/queue/scheduler:[none] mq-deadline
/sys/class/block/nvme5n1/queue/scheduler:[none] mq-deadline
/sys/class/block/nvme6n1/queue/scheduler:[none] mq-deadline
/sys/class/block/nvme7n1/queue/scheduler:[none] mq-deadline
/sys/class/block/nvme8n1/queue/scheduler:[none] mq-deadline
/sys/class/block/nvme9n1/queue/scheduler:[none] mq-deadline
Rerun the previous onessd.sh command with direct I/O enabled again and with 4kB I/O size, we get this:
---procs--- ----total-usage---- ------memory-usage----- --io/total- -dsk/total-
run blk new|usr sys idl wai stl| used  free  buf   cach| read  writ| read  writ
3.0   0   0|  4   8  90   0   0|2157M  248G   46M  730M| 525k    0 |2051M    0
3.0   0   0|  3   8  90   0   0|2157M  248G   46M  730M| 523k    0 |2041M    0
4.0   0   0|  4   8  91   0   0|2157M  248G   46M  730M| 524k 7.00 |2046M   52k
3.0   0   0|  3   8  90   0   0|2157M  248G   46M  730M| 532k 21.0 |2079M   84k
3.0   0   0|  3   8  90   0   0|2157M  248G   46M  730M| 527k    0 |2060M    0
3.0   0   0|  3   8  90   0   0|2157M  248G   46M  730M| 526k    0 |2056M    0 ^C
The “run” column shows just 3 threads running on CPU most of the time, there’s no need for hundreds of kernel threads doing concurrent I/O for pagecache. pSnapper confirms that, too. Note that you don’t have to run pSnapper with sudo if you’re not reporting the “advanced” columns like syscall and kstack.
$ psn

Linux Process Snapper v0.18 by Tanel Poder [https://0x.tools]
Sampling /proc/stat for 5 seconds... finished.


=== Active Threads ====================================================

 samples | avg_threads | comm                 | state
-----------------------------------------------------------------------
     300 |        3.00 | (fio)                | Running (ON CPU)
       3 |        0.03 | (kworker/*:*-events) | Running (ON CPU)
       1 |        0.01 | (jbd*/dm-*-*)        | Disk (Uninterruptible)
However, we only get ~525k IOPS out of these 3 processes running 100% on CPU, instead of 1150k IOPS seen earlier in my initial tests. So, with an I/O scheduler enabled, we get 2x less throughput with similar amount of CPU usage. In other, words - every I/O request seems to be using 2x more CPU now. This is not surprising, as the additional I/O scheduling magic needs to use CPU too.
As usual, you can run perf or look into a 0x.tools always-on CPU profiling output file from around the right time:
$ sudo perf report -i xcpu.2021012723091293
Partial output is below, I highlighted the interesting parts:
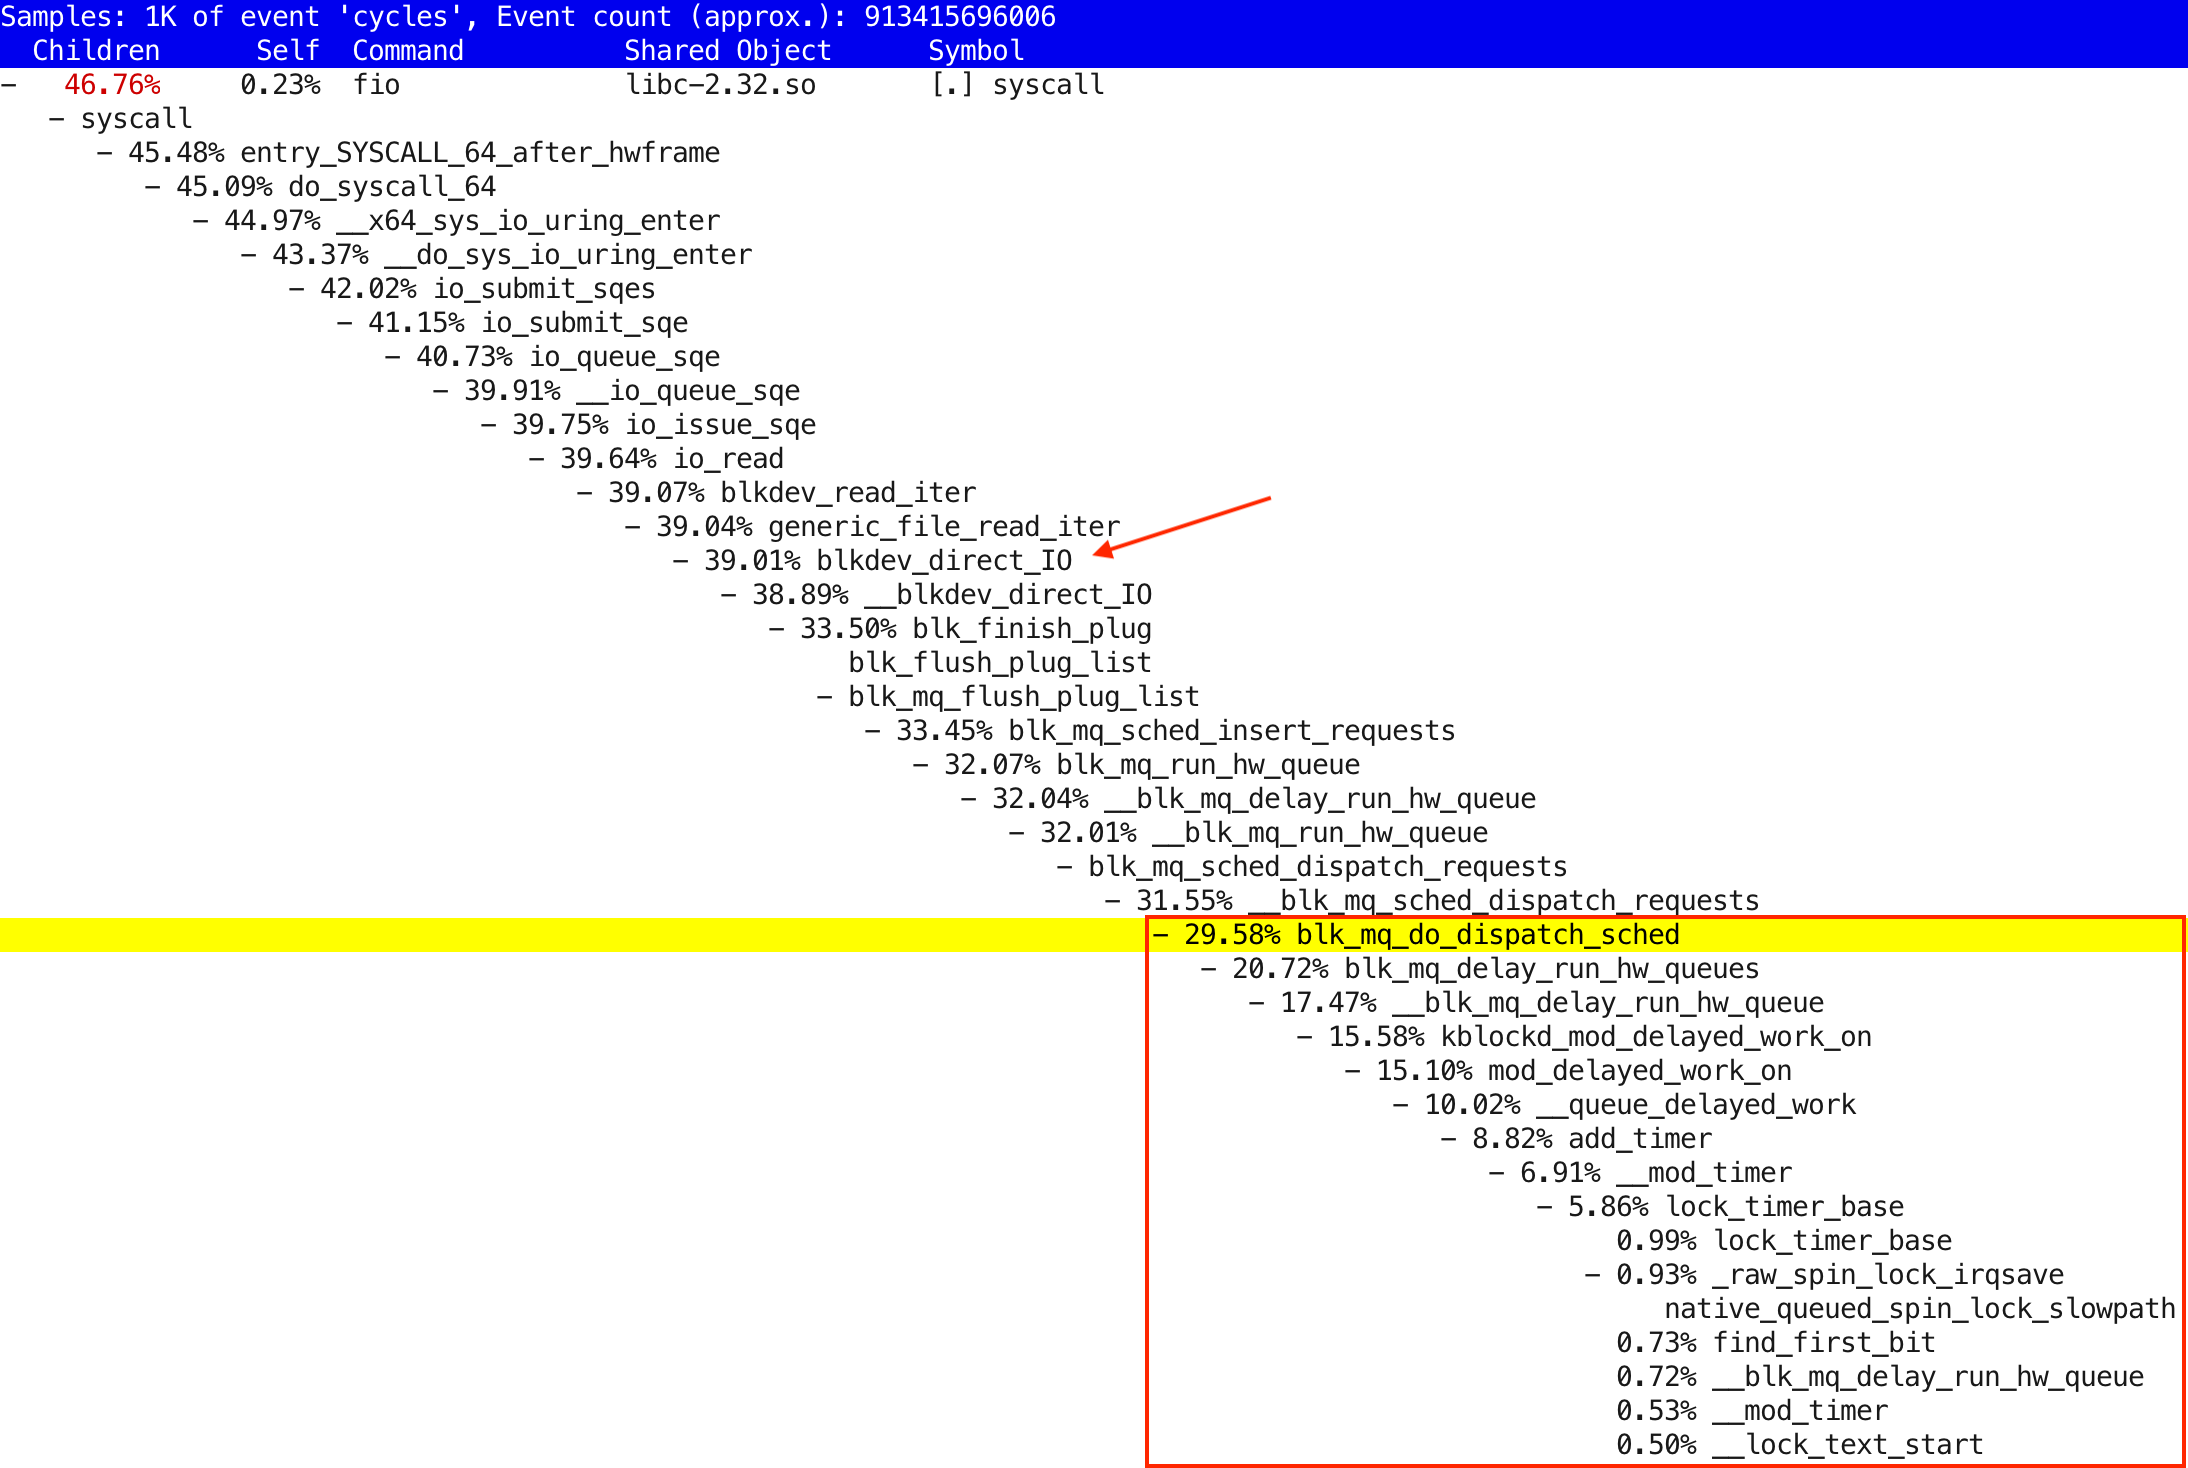
We are doing direct I/O, like the blkdev_direct_IO function in the stack shows, but in the bottom of the output, you see a lot of “timer” and “delay” functions show up under blk_mq_do_dispatch_sched. So, we will do extra CPU work for deciding whether an I/O request (that’s already submitted to the block device’s I/O queue in the OS) should be dispatched to the actual hardware device driver that’s handling this disk.
Ok, enough of this software stuff for now, as I mentioned I will write about performance of LVM, filesystems and databases in future posts, let’s move on.
Multi-disk test
We have been looking into just one disk’s performance so far! The hope is that now we have a better idea of theoretical max throughput of a single disk, when plenty of extra PCIe, inter-CPU-core and memory channel bandwidth was available. Now let’s put all 10 disks into use at the same time - and make sure that we have set them up right! I will show the command I used in the end of the post, let’s start with hardware setup & configuration.
PCIe 4.0 Quad-SSD adapter - Asus Hyper M.2 X16 Gen4 Card
The workstation had only 2 existing M.2 NVMe slots - and I deliberately stayed away from buying SATA SSDs as the SATA interface is completely different (and wayyy slower) than using direct PCIe-NVMe protocol. Lenovo sells quad M.2 SSD adapters that go into PCIe x16 slots, but the one they currently have supports only PCIe3.0 as far as I know.
I was happy to find that ASUS was already selling a PCIe4.0 capable adapter card that fits into a PCIe x16 slot and holds 4 x M.2 SSDs. All this for just $70. I had to buy two of these. 2 x 4 SSDs went inside these ASUS adapter cards and the remaining 2 SSDs went directly into the existing M.2 slots built in to the Lenovo machine.
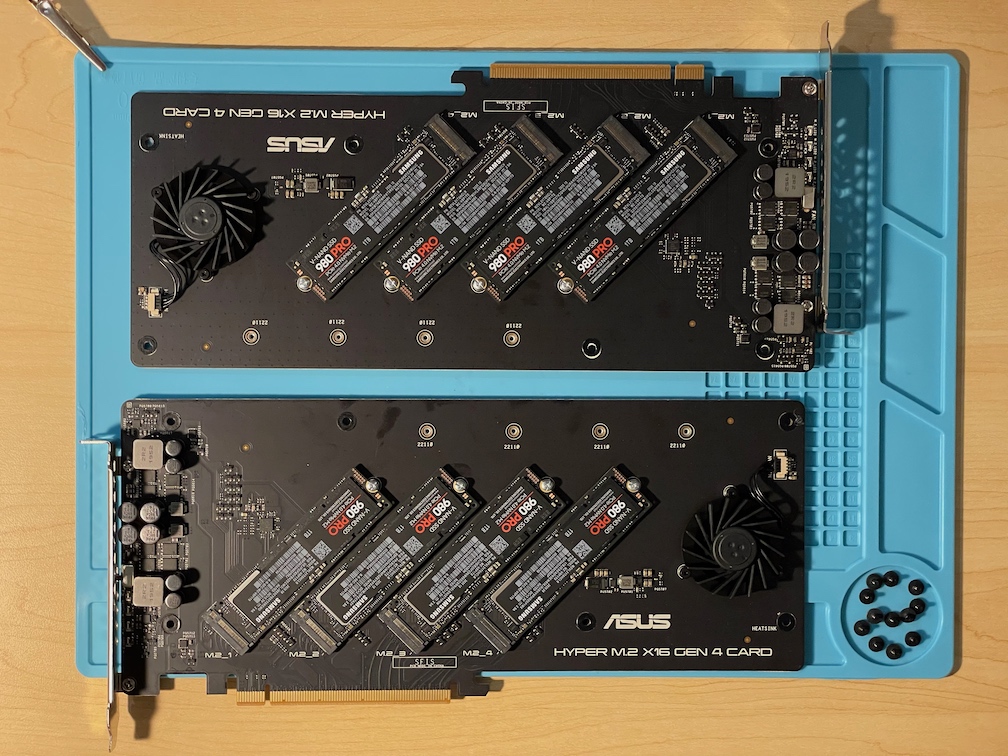
Should you want to buy similar adapters, make sure you buy the “Gen 4” version from ASUS if you need PCIe 4.0 compatibility. Or when buying a different brand, you don’t want to get an adapter that has a built-in PCIe switch in it, but a card (like ASUS) that supports the motherboard’s PCIe lane bifurcation directly (see below). Otherwise, you may end up with more latency and more potential bottlenecks, if the switch doesn’t support full PCIe 4.0 speeds.
BIOS Settings
I had to make two changes in BIOS. First, I had to manually configure the PCIe Port Bifurcation from Auto to x4x4x4x4 (other options were x16 and x8x8), as the BIOS didn’t automatically realize that I had 4 separate PCIe x4 devices plugged into that physical x16 slot (no disks showed up at all). Perhaps the auto-detection didn’t work as I wasn’t using the Lenovo’s official Quad SSD adapter.
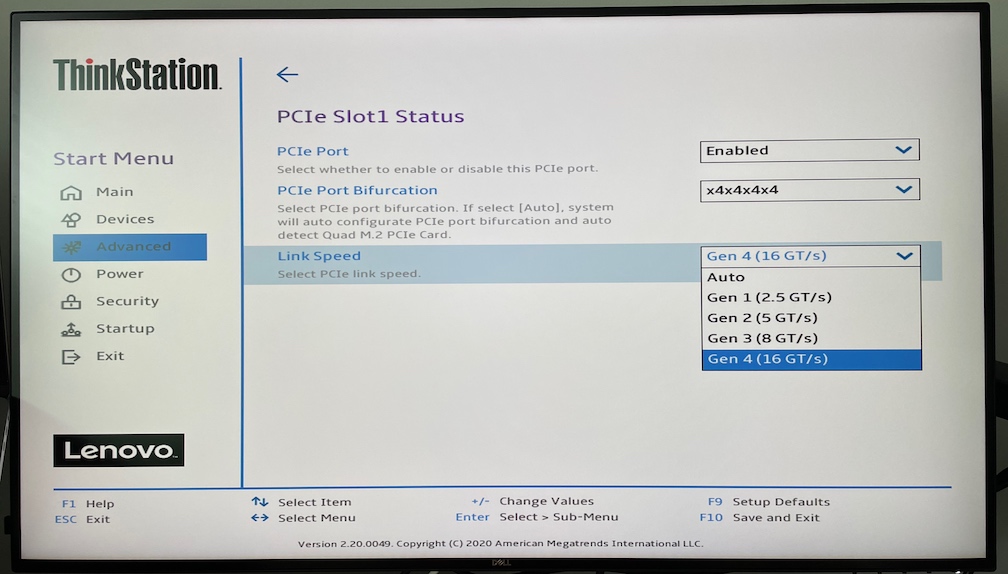
I also had to change the Link Speed from Auto to Gen 4 (16 GT/s), as otherwise BIOS defaulted the speed to PCIe 3.0 / Gen 3 and I got only half of the throughput out of the SSDs behind these Quad SSD adapters.
$ lspci -v
...
64:00.0 Non-Volatile memory controller: Samsung Electronics Co Ltd Device a80a (prog-if 02 [NVM Express])
	Subsystem: Samsung Electronics Co Ltd Device a801
	Flags: bus master, fast devsel, latency 0, IRQ 69, NUMA node 0, IOMMU group 16
	Memory at cc000000 (64-bit, non-prefetchable) [size=16K]
	Capabilities: [40] Power Management version 3
	Capabilities: [50] MSI: Enable- Count=1/32 Maskable- 64bit+
	Capabilities: [70] Express Endpoint, MSI 00
	Capabilities: [b0] MSI-X: Enable+ Count=130 Masked-
	Capabilities: [100] Advanced Error Reporting
	Capabilities: [168] Alternative Routing-ID Interpretation (ARI)
	Capabilities: [178] Secondary PCI Express
	Capabilities: [198] Physical Layer 16.0 GT/s
	Capabilities: [1bc] Lane Margining at the Receiver
	Capabilities: [214] Latency Tolerance Reporting
	Capabilities: [21c] L1 PM Substates
	Capabilities: [3a0] Data Link Feature
	Kernel driver in use: nvme
	Kernel modules: nvme
...
After enabling 16 GT/s from BIOS, I was able to get 6800 MiB/s read throughput from a single disk, yay! But…
PCIe Root Complex Bottleneck
I had physically installed the Quad SSD adapters like this (the adapter cards have a silver/aluminum casing):
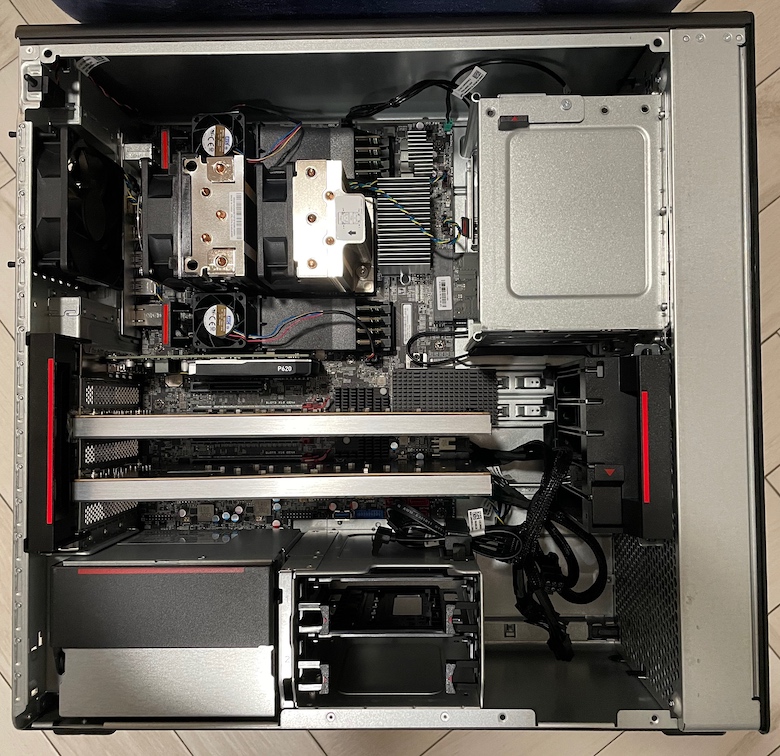
However, when running a throughput test with all disks and 1 MB read sizes, I got only about 50 GiB/s aggregate throughput. Pretty good, but 10 SSDs should have given up to 68 GiB/s, judging from their specs and individual single-disk tests. There must have been some bottleneck between the disks and my CPU.
Since multiple PCIe slots may be sharing a PCIe root complex and no component in the CPU-IO network topology has infinite bandwidth, I was wondering whether I had accidentally installed the SSD adapter cards under the same PCIe root complex. Modern CPUs can have separate sets of PCIe lanes connected to different “edges” of the CPU, similar to memory channels. So, if you place your PCIe cards suboptimally, you may end up saturating some PCIe lanes (going into the same CPU), while others have pretty low traffic.

Let’s see how many PCIe root complexes (PCIe lane sets connecting to the CPU) my machine has:
$ lspci | grep Root
00:00.0 Host bridge: Advanced Micro Devices, Inc. [AMD] Starship/Matisse Root Complex
20:00.0 Host bridge: Advanced Micro Devices, Inc. [AMD] Starship/Matisse Root Complex
40:00.0 Host bridge: Advanced Micro Devices, Inc. [AMD] Starship/Matisse Root Complex
60:00.0 Host bridge: Advanced Micro Devices, Inc. [AMD] Starship/Matisse Root Complex
So, 4 PCIe root complexes, each having 32 lanes (I’m assuming equal distribution, the system has 128 lanes in total).
The lspci command shows the PCIe network topology (click on the triangle below to expand). I have removed some unused device entries from the list. Also, I made the root complex nodes bold and the SSD devices yellow.
View lspci output (initial)
$ lspci -tv
-+-[0000:60]-+-00.0  Advanced Micro Devices, Inc. [AMD] Starship/Matisse Root Complex
 |           +-00.2  Advanced Micro Devices, Inc. [AMD] Starship/Matisse IOMMU
 |           +-01.0  Advanced Micro Devices, Inc. [AMD] Starship/Matisse PCIe Dummy Host Bridge
 |           +-02.0  Advanced Micro Devices, Inc. [AMD] Starship/Matisse PCIe Dummy Host Bridge
 |           +-03.0  Advanced Micro Devices, Inc. [AMD] Starship/Matisse PCIe Dummy Host Bridge
 |           +-03.1-[61]--+-00.0  NVIDIA Corporation GP107GL [Quadro P620]
 |           |            \-00.1  NVIDIA Corporation GP107GL High Definition Audio Controller
 |           +-07.1-[62]----00.0  Advanced Micro Devices, Inc. [AMD] Starship/Matisse PCIe Dummy Function
 |           +-08.0  Advanced Micro Devices, Inc. [AMD] Starship/Matisse PCIe Dummy Host Bridge
 |           \-08.1-[63]----00.0  Advanced Micro Devices, Inc. [AMD] Starship/Matisse Reserved SPP
 +-[0000:40]-+-00.0  Advanced Micro Devices, Inc. [AMD] Starship/Matisse Root Complex
 |           +-00.2  Advanced Micro Devices, Inc. [AMD] Starship/Matisse IOMMU
 |           +-01.1-[41]----00.0  Samsung Electronics Co Ltd Device a80a
 |           +-01.2-[42]----00.0  Samsung Electronics Co Ltd Device a80a
 |           +-01.3-[43]----00.0  Samsung Electronics Co Ltd Device a80a
 |           +-01.4-[44]----00.0  Samsung Electronics Co Ltd Device a80a
 |           +-02.0  Advanced Micro Devices, Inc. [AMD] Starship/Matisse PCIe Dummy Host Bridge
 |           +-03.0  Advanced Micro Devices, Inc. [AMD] Starship/Matisse PCIe Dummy Host Bridge
 |           +-03.1-[45]----00.0  Samsung Electronics Co Ltd Device a80a
 |           +-03.2-[46]----00.0  Samsung Electronics Co Ltd Device a80a
 |           +-03.3-[47]----00.0  Samsung Electronics Co Ltd Device a80a
 |           +-03.4-[48]----00.0  Samsung Electronics Co Ltd Device a80a
 |           +-07.1-[49]----00.0  Advanced Micro Devices, Inc. [AMD] Starship/Matisse PCIe Dummy Function
 |           +-08.0  Advanced Micro Devices, Inc. [AMD] Starship/Matisse PCIe Dummy Host Bridge
 |           \-08.1-[4a]----00.0  Advanced Micro Devices, Inc. [AMD] Starship/Matisse Reserved SPP
 +-[0000:20]-+-00.0  Advanced Micro Devices, Inc. [AMD] Starship/Matisse Root Complex
 |           +-00.2  Advanced Micro Devices, Inc. [AMD] Starship/Matisse IOMMU
 |           +-01.0  Advanced Micro Devices, Inc. [AMD] Starship/Matisse PCIe Dummy Host Bridge
 |           +-01.1-[21]----00.0  Samsung Electronics Co Ltd Device a80a
 |           +-01.2-[22]----00.0  Samsung Electronics Co Ltd Device a80a
 |           +-07.1-[23]----00.0  Advanced Micro Devices, Inc. [AMD] Starship/Matisse PCIe Dummy Function
 |           +-08.0  Advanced Micro Devices, Inc. [AMD] Starship/Matisse PCIe Dummy Host Bridge
 |           \-08.1-[24]--+-00.0  Advanced Micro Devices, Inc. [AMD] Starship/Matisse Reserved SPP
 |                        +-00.1  Advanced Micro Devices, Inc. [AMD] Starship/Matisse Cryptographic Coprocessor PSPCPP
 |                        \-00.3  Advanced Micro Devices, Inc. [AMD] Starship USB 3.0 Host Controller
 \-[0000:00]-+-00.0  Advanced Micro Devices, Inc. [AMD] Starship/Matisse Root Complex
             +-00.2  Advanced Micro Devices, Inc. [AMD] Starship/Matisse IOMMU
             +-01.0  Advanced Micro Devices, Inc. [AMD] Starship/Matisse PCIe Dummy Host Bridge
             +-01.1-[01]----00.0  Aquantia Corp. AQC107 NBase-T/IEEE 802.3bz Ethernet Controller [AQtion]
             +-02.0  Advanced Micro Devices, Inc. [AMD] Starship/Matisse PCIe Dummy Host Bridge
             +-03.0  Advanced Micro Devices, Inc. [AMD] Starship/Matisse PCIe Dummy Host Bridge
             +-03.1-[02-06]----00.0-[03-06]--+-08.0-[04]--+-00.0  Advanced Micro Devices, Inc. [AMD] Starship/Matisse Reserved SPP
             |                               |            +-00.1  Advanced Micro Devices, Inc. [AMD] Matisse USB 3.0 Host Controller
             |                               |            \-00.3  Advanced Micro Devices, Inc. [AMD] Matisse USB 3.0 Host Controller
             |                               +-09.0-[05]----00.0  Advanced Micro Devices, Inc. [AMD] FCH SATA Controller [AHCI mode]
             |                               \-0a.0-[06]----00.0  Advanced Micro Devices, Inc. [AMD] FCH SATA Controller [AHCI mode]
             +-07.1-[07]----00.0  Advanced Micro Devices, Inc. [AMD] Starship/Matisse PCIe Dummy Function
             +-08.0  Advanced Micro Devices, Inc. [AMD] Starship/Matisse PCIe Dummy Host Bridge
             +-08.1-[08]--+-00.0  Advanced Micro Devices, Inc. [AMD] Starship/Matisse Reserved SPP
             |            \-00.3  Advanced Micro Devices, Inc. [AMD] Starship USB 3.0 Host Controller
             +-14.0  Advanced Micro Devices, Inc. [AMD] FCH SMBus Controller
             +-14.3  Advanced Micro Devices, Inc. [AMD] FCH LPC Bridge
             \-18.7  Advanced Micro Devices, Inc. [AMD] Starship Device 24; Function 7
Indeed, I had accidentally placed both quad SSD cards into two PCIe slots that were connected to the same PCIe root complex (and connection to the CPU). When setting things up, I didn’t bother diving deep into this workstation’s documentation and got unlucky. The two additional Samsung devices under 0000:20 are the SSDs that I plugged into the M.2 slots already built in to the workstation.
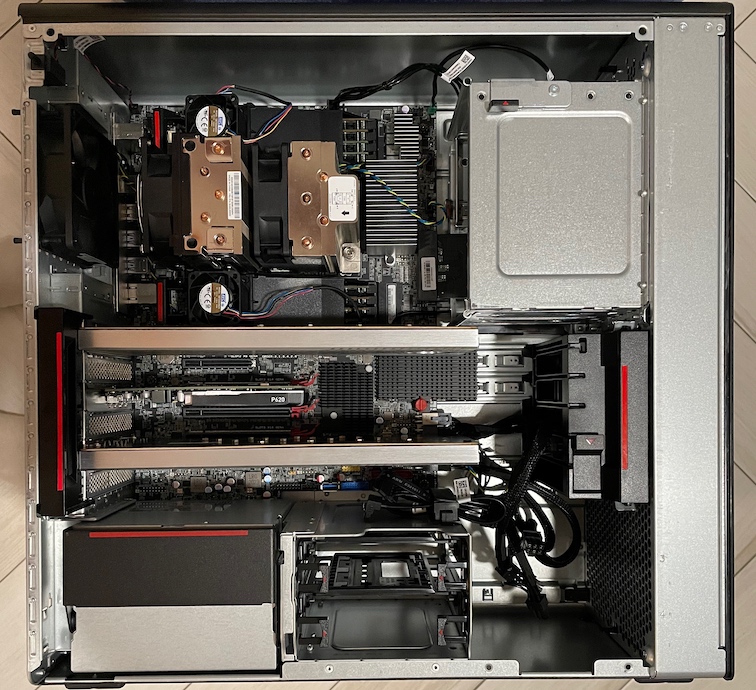
PCIe Root Complex Bottleneck (after)
From the lspci output above you can see that my NVIDIA GPU is under the PCIe address 0000:60 and there are no other I/O hungry cards there. Since I’m currently not using the GPU on that machine, I just swapped one of the Quad SSD adapters with the “mostly idle” video card. Now each of the quad SSD adapters can feed their data through separate PCIe root complexes.
View lspci output (after moving cards around)
$ sudo lspci -tv
-+-[0000:60]-+-00.0  Advanced Micro Devices, Inc. [AMD] Starship/Matisse Root Complex
 |           +-00.2  Advanced Micro Devices, Inc. [AMD] Starship/Matisse IOMMU
 |           +-01.0  Advanced Micro Devices, Inc. [AMD] Starship/Matisse PCIe Dummy Host Bridge
 |           +-02.0  Advanced Micro Devices, Inc. [AMD] Starship/Matisse PCIe Dummy Host Bridge
 |           +-03.0  Advanced Micro Devices, Inc. [AMD] Starship/Matisse PCIe Dummy Host Bridge
 |           +-03.1-[61]----00.0  Samsung Electronics Co Ltd Device a80a
 |           +-03.2-[62]----00.0  Samsung Electronics Co Ltd Device a80a
 |           +-03.3-[63]----00.0  Samsung Electronics Co Ltd Device a80a
 |           +-03.4-[64]----00.0  Samsung Electronics Co Ltd Device a80a
 |           +-07.1-[65]----00.0  Advanced Micro Devices, Inc. [AMD] Starship/Matisse PCIe Dummy Function
 |           +-08.0  Advanced Micro Devices, Inc. [AMD] Starship/Matisse PCIe Dummy Host Bridge
 |           \-08.1-[66]----00.0  Advanced Micro Devices, Inc. [AMD] Starship/Matisse Reserved SPP
 +-[0000:40]-+-00.0  Advanced Micro Devices, Inc. [AMD] Starship/Matisse Root Complex
 |           +-00.2  Advanced Micro Devices, Inc. [AMD] Starship/Matisse IOMMU
 |           +-01.0  Advanced Micro Devices, Inc. [AMD] Starship/Matisse PCIe Dummy Host Bridge
 |           +-01.1-[41]--+-00.0  NVIDIA Corporation GP107GL [Quadro P620]
 |           |            \-00.1  NVIDIA Corporation GP107GL High Definition Audio Controller
 |           +-02.0  Advanced Micro Devices, Inc. [AMD] Starship/Matisse PCIe Dummy Host Bridge
 |           +-03.0  Advanced Micro Devices, Inc. [AMD] Starship/Matisse PCIe Dummy Host Bridge
 |           +-03.1-[42]----00.0  Samsung Electronics Co Ltd Device a80a
 |           +-03.2-[43]----00.0  Samsung Electronics Co Ltd Device a80a
 |           +-03.3-[44]----00.0  Samsung Electronics Co Ltd Device a80a
 |           +-03.4-[45]----00.0  Samsung Electronics Co Ltd Device a80a
 |           +-07.1-[46]----00.0  Advanced Micro Devices, Inc. [AMD] Starship/Matisse PCIe Dummy Function
 |           +-08.0  Advanced Micro Devices, Inc. [AMD] Starship/Matisse PCIe Dummy Host Bridge
 |           \-08.1-[47]----00.0  Advanced Micro Devices, Inc. [AMD] Starship/Matisse Reserved SPP
 +-[0000:20]-+-00.0  Advanced Micro Devices, Inc. [AMD] Starship/Matisse Root Complex
 |           +-00.2  Advanced Micro Devices, Inc. [AMD] Starship/Matisse IOMMU
 |           +-01.0  Advanced Micro Devices, Inc. [AMD] Starship/Matisse PCIe Dummy Host Bridge
 |           +-01.1-[21]----00.0  Samsung Electronics Co Ltd Device a80a
 |           +-01.2-[22]----00.0  Samsung Electronics Co Ltd Device a80a
 |           +-07.1-[23]----00.0  Advanced Micro Devices, Inc. [AMD] Starship/Matisse PCIe Dummy Function
 |           +-08.0  Advanced Micro Devices, Inc. [AMD] Starship/Matisse PCIe Dummy Host Bridge
 |           \-08.1-[24]--+-00.0  Advanced Micro Devices, Inc. [AMD] Starship/Matisse Reserved SPP
 |                        +-00.1  Advanced Micro Devices, Inc. [AMD] Starship/Matisse Cryptographic Coprocessor PSPCPP
 |                        \-00.3  Advanced Micro Devices, Inc. [AMD] Starship USB 3.0 Host Controller
 \-[0000:00]-+-00.0  Advanced Micro Devices, Inc. [AMD] Starship/Matisse Root Complex
             +-00.2  Advanced Micro Devices, Inc. [AMD] Starship/Matisse IOMMU
             +-01.0  Advanced Micro Devices, Inc. [AMD] Starship/Matisse PCIe Dummy Host Bridge
             +-01.1-[01]----00.0  Aquantia Corp. AQC107 NBase-T/IEEE 802.3bz Ethernet Controller [AQtion]
             +-02.0  Advanced Micro Devices, Inc. [AMD] Starship/Matisse PCIe Dummy Host Bridge
             +-03.0  Advanced Micro Devices, Inc. [AMD] Starship/Matisse PCIe Dummy Host Bridge
             +-03.1-[02-06]----00.0-[03-06]--+-08.0-[04]--+-00.0  Advanced Micro Devices, Inc. [AMD] Starship/Matisse Reserved SPP
             |                               |            +-00.1  Advanced Micro Devices, Inc. [AMD] Matisse USB 3.0 Host Controller
             |                               |            \-00.3  Advanced Micro Devices, Inc. [AMD] Matisse USB 3.0 Host Controller
             |                               +-09.0-[05]----00.0  Advanced Micro Devices, Inc. [AMD] FCH SATA Controller [AHCI mode]
             |                               \-0a.0-[06]----00.0  Advanced Micro Devices, Inc. [AMD] FCH SATA Controller [AHCI mode]
             +-07.1-[07]----00.0  Advanced Micro Devices, Inc. [AMD] Starship/Matisse PCIe Dummy Function
             +-08.0  Advanced Micro Devices, Inc. [AMD] Starship/Matisse PCIe Dummy Host Bridge
             +-08.1-[08]--+-00.0  Advanced Micro Devices, Inc. [AMD] Starship/Matisse Reserved SPP
             |            \-00.3  Advanced Micro Devices, Inc. [AMD] Starship USB 3.0 Host Controller
             +-14.0  Advanced Micro Devices, Inc. [AMD] FCH SMBus Controller
             +-14.3  Advanced Micro Devices, Inc. [AMD] FCH LPC Bridge
             \-18.7  Advanced Micro Devices, Inc. [AMD] Starship Device 24; Function 7
So, now both of the heavy-hitting quad SSD cards have their own PCIe root complex to communicate through. The NVIDIA Quadro P620 video card shares the same PCIe root complex with one quad SSD adapter, but since I’m not using the GPU in this machine for anything, I don’t expect it to eat significant bandwidth.
Final results
So, here are the promised results! Let’s execute 10 fio commands concurrently (the script is listed below):
$ sudo ./allmulti.sh 4k

[10] + Running
[9] - Running
[8]   Running
[7]   Running
[6]   Running
[5]   Running
[4]   Running
[3]   Running
[2]   Running
[1]   Running
We get up to 11 million IOPS with 4k reads (while CPUs are 100% busy, mostly in kernel mode):
$ dstat -pcmrd

---procs--- ----total-usage---- ------memory-usage----- --io/total- -dsk/total-
run blk new|usr sys idl wai stl| used  free  buf   cach| read  writ| read  writ
 32   0   0| 27  73   0   0   0|2232M  249G   61M  568M|11.1M    0 |  42G    0
 33   0   0| 27  73   0   0   0|2232M  249G   61M  568M|11.1M    0 |  42G    0
 33   0   0| 27  73   0   0   0|2232M  249G   61M  568M|11.1M    0 |  42G    0
 32   0   0| 27  73   0   0   0|2232M  249G   61M  568M|11.1M    0 |  42G    0
 32   0   0| 27  73   0   0   0|2232M  249G   61M  568M|11.0M    0 |  42G    0
 32   0   0| 27  73   0   0   0|2232M  249G   61M  568M|11.0M    0 |  42G    0
 32   0   0| 28  73   0   0   0|2232M  249G   61M  568M|11.1M    0 |  42G    0
 32   0   0| 27  73   0   0   0|2232M  249G   61M  568M|11.1M    0 |  42G    0
 32   0   0| 27  72   0   0   0|2232M  249G   61M  568M|11.1M    0 |  42G    0
 32   0   0| 27  73   0   0   0|2232M  249G   61M  568M|11.1M    0 |  42G    0
Since issuing so many block I/Os on my 16-core CPU keeps it 100% busy, I had to find other tricks to reduce the CPU usage of fio and I/O handling layer in general. This is why I’m running 10 separate fio commands (one for each disk) as when using one single fio instance accessing all 10 disks, I couldn’t get beyond some measly 8M IOPS while using 100% CPU. Possibly there’s some internal coordination overhead in fio, but I didn’t drill down into that, running separate fio instances was an acceptable workaround:
allmulti.sh:
./onessd.sh 3 /dev/nvme0n1 $1 &
./onessd.sh 3 /dev/nvme1n1 $1 &
./onessd.sh 3 /dev/nvme2n1 $1 &
./onessd.sh 3 /dev/nvme3n1 $1 &
./onessd.sh 3 /dev/nvme4n1 $1 &
./onessd.sh 3 /dev/nvme5n1 $1 &
./onessd.sh 3 /dev/nvme6n1 $1 &
./onessd.sh 3 /dev/nvme7n1 $1 &
./onessd.sh 4 /dev/nvme8n1 $1 &
./onessd.sh 4 /dev/nvme9n1 $1 &
jobs
wait
At 4k I/O size, I also set fio --hipri option as this does not rely on interrupts to get notified about I/O completions, instead if polls for completion in a busy-loop on CPU. Since my CPUs were 100% busy under this load anyway, then not having to handle interrupts and go “straight to the source”, polling I/O states from NVMe queues via direct device-mapped memory reads. This kind of busy-loop polling on all CPU cores is probably not practical for real-life workloads, but for real-life workloads I wouldn’t be so cheap and would go buy a bigger CPU.
onessd.sh:
$ cat onessd.sh
#!/bin/bash

[ $# -ne 3 ] && echo Usage $0 numjobs /dev/DEVICENAME BLOCKSIZE && exit 1

fio --readonly --name=onessd \
    --filename=$2 \
    --filesize=900g --rw=randread --bs=$3 --direct=1 --overwrite=0 \
    --numjobs=$1 --iodepth=32 --time_based=1 --runtime=3600 \
    --ioengine=io_uring \
    --registerfiles --fixedbufs --hipri \
    --gtod_reduce=1 --group_reporting --minimal
For final tests, I even disabled the frequent gettimeofday system calls that are used for I/O latency measurement. Less CPU usage = More IOPS when you’re bottlenecked by CPU capacity.
I removed the --fixedpri option in following tests, as with larger I/O sizes, the bottleneck is in waiting for the NVMe device’s DMA engine that in turn waits for the disk -> RAM memory copy to finish (over the PCIe network to memory channels to memory DIMMs). I’d rather let my application threads to go sleep and be waken up later by OS scheduler who receives an interrupt, so some CPU time would be available for application processing too!
In my earlier tests, 1M I/Os were split to 512k apparently (or perhaps fio didn’t request higher I/O sizes itself), I’ll run a 512k I/O size test:
$ sudo ./allmulti.sh 512k
...

$ sudo dstat -pmrd --bw
---procs--- ------memory-usage----- --io/total- -dsk/total-
run blk new| used  free  buf   cach| read  writ| read  writ
2.0   0   0|2402M  249G   47M  427M| 138k    0 |  66G    0
1.0   0   0|2402M  249G   47M  427M| 138k    0 |  66G    0
1.0   0   0|2402M  249G   47M  427M| 138k    0 |  66G    0
1.0   0   0|2402M  249G   47M  427M| 138k    0 |  66G    0
3.0   0   0|2402M  249G   47M  427M| 138k 3.00 |  66G   20k
We are now doing 138k IOPS with 512kB block size, this translates to 66 GiB/s throughput (71 GB/s when reporting the units correctly). And look at the CPU usage - my total CPU utilization is only around 7.5%!
$ sudo mpstat 1
Linux 5.8.0-29-generic (linux02) 	01/28/2021 	_x86_64_	(32 CPU)

01:31:25 PM  CPU    %usr   %nice    %sys %iowait    %irq   %soft   %idle
01:31:26 PM  all    0.64    0.00    6.68    0.00    0.00    0.13   92.55
01:31:27 PM  all    0.74    0.00    6.85    0.00    0.00    0.19   92.21
01:31:28 PM  all    0.55    0.00    6.65    0.00    0.00    0.23   92.57
01:31:29 PM  all    0.58    0.00    6.71    0.00    0.00    0.19   92.52
01:31:30 PM  all    0.58    0.00    6.97    0.00    0.00    0.03   92.42
Note that I used mpstat for CPU reporting in this case, I hit some sort of dstat bug that didn’t report CPU correctly in this case. I possibly happens due to this Ubuntu kernel not being configured to break out interrupt reporting separately (I will write about this in the future).
The full iostat output is here too (it’s pretty wide).
This is from the 4k maximize IOPS test:
Device            r/s     rMB/s   rrqm/s  %rrqm r_await rareq-sz     w/s     wMB/s   wrqm/s  %wrqm w_await wareq-sz     d/s     dMB/s   drqm/s  %drqm d_await dareq-sz     f/s f_await  aqu-sz  %util
nvme0n1       1090190.40   4258.56     0.00   0.00    0.02     4.00    0.00      0.00     0.00   0.00    0.00     0.00    0.00      0.00     0.00   0.00    0.00     0.00    0.00    0.00   19.40 100.16
nvme1n1       1062752.40   4151.38     0.00   0.00    0.02     4.00    0.00      0.00     0.00   0.00    0.00     0.00    0.00      0.00     0.00   0.00    0.00     0.00    0.00    0.00   17.47 100.00
nvme2n1       1103848.80   4311.91     0.00   0.00    0.02     4.00    0.00      0.00     0.00   0.00    0.00     0.00    0.00      0.00     0.00   0.00    0.00     0.00    0.00    0.00   21.18 100.00
nvme3n1       1111700.20   4342.58     0.00   0.00    0.02     4.00    0.00      0.00     0.00   0.00    0.00     0.00    0.00      0.00     0.00   0.00    0.00     0.00    0.00    0.00   25.17 100.16
nvme4n1       1101897.20   4304.29     0.00   0.00    0.02     4.00    0.00      0.00     0.00   0.00    0.00     0.00    0.00      0.00     0.00   0.00    0.00     0.00    0.00    0.00   22.81 100.48
nvme5n1       1105498.00   4318.35     0.00   0.00    0.02     4.00    0.00      0.00     0.00   0.00    0.00     0.00    0.00      0.00     0.00   0.00    0.00     0.00    0.00    0.00   24.45 100.00
nvme6n1       1046649.00   4088.47     0.00   0.00    0.02     4.00    0.00      0.00     0.00   0.00    0.00     0.00    0.00      0.00     0.00   0.00    0.00     0.00    0.00    0.00   16.97 100.48
nvme7n1       1061635.00   4147.01     0.00   0.00    0.02     4.00    0.00      0.00     0.00   0.00    0.00     0.00    0.00      0.00     0.00   0.00    0.00     0.00    0.00    0.00   17.83 100.00
nvme8n1       1134761.40   4432.69     6.00   0.00    0.35     4.00   20.20      0.11     1.00   4.72    0.03     5.82    0.00      0.00     0.00   0.00    0.00     0.00    0.00    0.00  400.48 100.64
nvme9n1       1128532.40   4408.33     0.00   0.00    0.37     4.00    0.00      0.00     0.00   0.00    0.00     0.00    0.00      0.00     0.00   0.00    0.00     0.00    0.00    0.00  415.12 100.32
Probably all disks above would have been able to deliver over 1.1M IOPS each, but my CPUs just couldn’t issue & handle I/O requests fast enough!
This is from a test where I used 64kB/s I/O sizes (16 x bigger IO size compared to 4k). This test was able to saturate the 66 GiB/s max disk throughput, yet do 1M IOPS in aggregate and have 75% of CPU time free for application work!
Device            r/s     rMB/s   rrqm/s  %rrqm r_await rareq-sz     w/s     wMB/s   wrqm/s  %wrqm w_await wareq-sz     d/s     dMB/s   drqm/s  %drqm d_await dareq-sz     f/s f_await  aqu-sz  %util
nvme0n1       108722.00   6795.12     0.00   0.00    3.08    64.00    0.00      0.00     0.00   0.00    0.00     0.00    0.00      0.00     0.00   0.00    0.00     0.00    0.00    0.00  335.35 100.00
nvme1n1       108723.20   6795.20     0.00   0.00    3.09    64.00    0.00      0.00     0.00   0.00    0.00     0.00    0.00      0.00     0.00   0.00    0.00     0.00    0.00    0.00  336.12 100.00
nvme2n1       108711.40   6794.46     0.00   0.00    3.08    64.00    0.00      0.00     0.00   0.00    0.00     0.00    0.00      0.00     0.00   0.00    0.00     0.00    0.00    0.00  335.34 100.00
nvme3n1       108719.00   6794.94     0.00   0.00    3.09    64.00    0.00      0.00     0.00   0.00    0.00     0.00    0.00      0.00     0.00   0.00    0.00     0.00    0.00    0.00  335.49 100.00
nvme4n1       108720.40   6795.02     0.00   0.00    3.09    64.00    0.00      0.00     0.00   0.00    0.00     0.00    0.00      0.00     0.00   0.00    0.00     0.00    0.00    0.00  335.48 100.00
nvme5n1       108721.00   6795.06     0.00   0.00    3.09    64.00    0.00      0.00     0.00   0.00    0.00     0.00    0.00      0.00     0.00   0.00    0.00     0.00    0.00    0.00  336.16 100.00
nvme6n1       108722.60   6795.16     0.00   0.00    3.09    64.00    0.00      0.00     0.00   0.00    0.00     0.00    0.00      0.00     0.00   0.00    0.00     0.00    0.00    0.00  336.41 100.00
nvme7n1       108722.00   6795.12     0.00   0.00    3.09    64.00    0.00      0.00     0.00   0.00    0.00     0.00    0.00      0.00     0.00   0.00    0.00     0.00    0.00    0.00  336.17 100.00
nvme8n1       108621.40   6788.84     0.00   0.00    4.14    64.00    0.00      0.00     0.00   0.00    0.00     0.00    0.00      0.00     0.00   0.00    0.00     0.00    0.00    0.00  450.22 100.00
nvme9n1       108738.80   6796.17     0.00   0.00    4.14    64.00    0.00      0.00     0.00   0.00    0.00     0.00    0.00      0.00     0.00   0.00    0.00     0.00    0.00    0.00  450.09 100.00
Summary
Modern machines are ridiculously fast! You just have to build, configure and use them right. Modern SSDs are super-fast, the PCIe 4.0/CPU/RAM network has very high throughput if you have enough PCIe lanes, memory channels (with enough memory banks populated with DIMMs) and when there’s no CPU- or front-side-bus-imposed data transfer bottleneck (in some IO hub in your old-school architecture).
As I mentioned in the beginning, having 128 x PCIe 4.0 lanes is what makes this ridiculous I/O throughput (for a desktop workstation!) possible and the 8 memory channels should make a difference when I actually start using the blocks of data just read from disk.
- Computers are networks.
- PCIe, memory channel networks are just one part of the story.
- Modern CPUs have networks within them, and their layout & capabilities differ by vendor and generation!
- No network has infinite bandwidth and zero latency.
- Disk I/O used to be the slow part of computing …
- Today the bottleneck is CPU and feeding that CPU via multiple levels of networks inside your computer.
Thanks for reading all the way to the end! There will be more posts where I put the same machine into use using various database workloads, including heavy writes, different filesystems - and maybe even throw a GPU in the mix!
More stuff!
- You can subscribe to email updates or follow me here.
- Video walkthrough (based on this article): High-Performance block I/O on Linux
- HackerNews discussion (2021)
Further reading
- High Performance Linux Block I/O video - it’s a follow up “hacking session” video to this article
- High Linux System Load - drilling down into kernel thread activity
- 0x.tools - Always-on Profiling for Production Systems