Thank you for attending the Exadata Snapper (ExaSnapper) hacking session!
I have split the recording of this session into 3 pieces and uploaded to enkitec.tv. The ExaSnapper beta that I demoed is also available now in my blog. See the links below.
For quick reference, here’s the syntax of running ExaSnapper – there are two modes, one is the before/after capture (think Tom Kyte’s runstats, but for exadata metrics) and the other is more like a DBA-monitoring mode, where you can just measure a few seconds worth of a long-running query runtime and get the IO and efficiency figures from there.
Here’s an excerpt from the install script documentation section:
-- Usage:       Take a snapshot of a running session (use QC SID if PX):
--
--                a) Monitor a running query - "DBA mode"
--
--                   SELECT * FROM TABLE(exasnap.display_sid(, [snap_seconds], [detail_level]));
--
--                   The SID argument can be just a number (SID in local instance) or a remote SID with
--                   @instance after it (like '123@4')
--
--                   SELECT * FROM TABLE(exasnap.display_sid(123));
--                   SELECT * FROM TABLE(exasnap.display_sid('123@4', p_detail=>'%');
--
--                b) Take Before & After snapshots of a query execution - "Developer Mode"
--
--                   1) SELECT exasnap.begin_snap(123) FROM dual;
--                        or
--                      EXEC :begin_snap_id := exasnap.begin_snap(123);
--
--                   2) Run your query, wait until it finishes (or CTRL+C)
--
--                   3) SELECT exasnap.end_snap(123) FROM dual;
--                        or
--                      EXEC :end_snap_id := exasnap.end_snap(123);
--
--                   4) SELECT * FROM TABLE(exasnap.display_snap(:begin_snap_id, :end_snap_id, '%'));
--
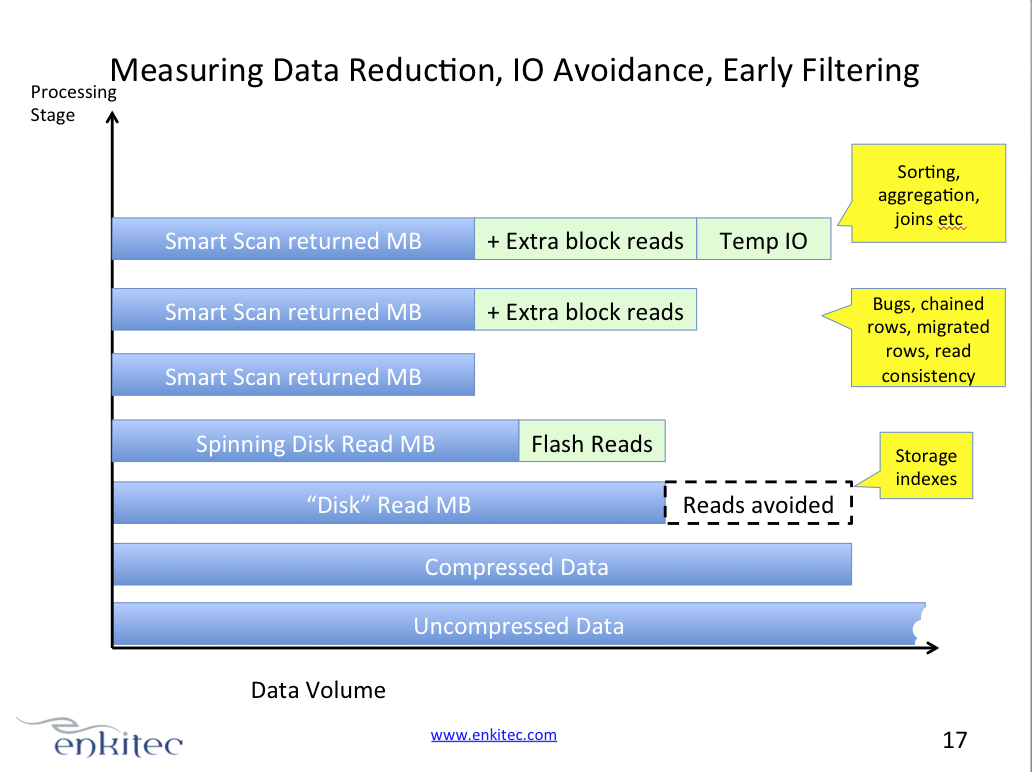
One slide illustrating the idea of ExaSnapper:
One screenshot of ExaSnapper output:
Watch the videos to see more!

Videos:
Slides:
ExaSnapper install script:
Also, if you’re serious about learning more about Exadata, from The Exadata Experts, check out our training pages , I’m running my Advanced Exadata Performance seminar the first time in May :-)