Training overview
The emphasis of this class is on practical application troubleshooting and Linux OS performance tuning techniques. We’ll be using scripts and tools that you can use on any Linux machine whenever a problem happens, without having to first install a complex layer of monitoring tools.
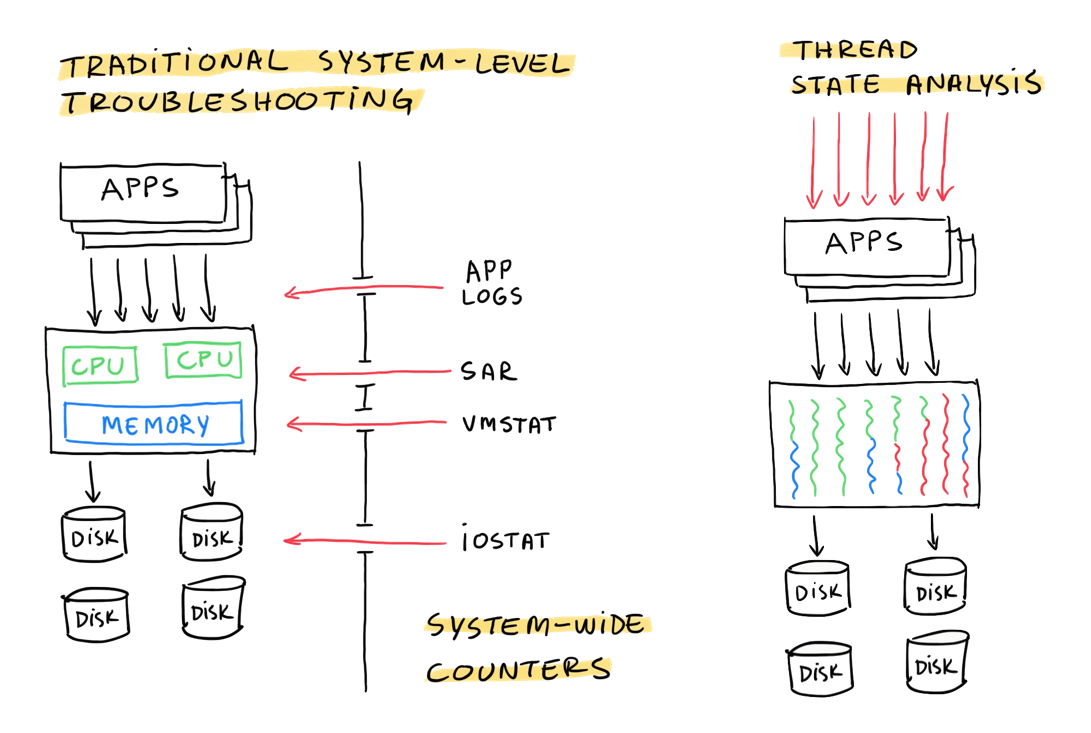
At the same time, we will go way beyond what the classic sysadmin tools (like vmstat, iostat, top) have to offer. We will use a process/thread-level sampling approach instead of system wide averages and drill down into application activity from there.

There is also “application troubleshooting” in this class title - in addition to GNU/Linux OS, we are going to spend lots of time troubleshooting Linux-based applications (Java apps, database engines, web servers etc.) with OS tools. This is useful for augmenting the application’s built-in instrumentation and logging, or in cases where the app doesn’t have decent logging enabled at all.
While we won’t spend time on non-practical tasks like compiling Linux kernels, we will regularly examine kernel activity using Linux built-in diagnostic & tracing facilities like strace, perf, ftrace, blktrace and the latest eBPF tracing tools. We won’t write Linux kernel source code but will learn how to find and read the relevant source files of interest to aid practical troubleshooting and avoid guesswork.
The full description and table of contents of this training are downloadable below:
Go to my new learning platform here:
Training Duration and Details
- As I am doing all my training courses using a new format now (self paced video learning + regular Q&A follow-up sessions), you can learn at any time, anywhere.
- Check out the new learning platform out here:
Objectives
- Navigate around in Linux process state & performance metrics like a boss
- Learn the systematic process-level troubleshooting approach all the way to OS kernel
- Familiarize yourself with scripts and tools that can quickly & safely be used in production
- Tune the operating system settings to improve your application performance
- Find application bottlenecks, inefficiencies and suboptimal patterns of OS API usage
Non-objectives
- This is not a Linux administration class
- This is not a typical OS-only tuning & configuration class aimed just for sysadmins
- While we look into measuring Java, C/C++, python apps, this is not a developer coding class
- While we look into database engines at OS level, this is not a RDBMS or SQL tuning class
- While we troubleshoot OS-level network activity, this is not a network administration class
Recommended Prerequisites
- Basic understanding of OS concepts: processes, threads, files & file systems, devices
- Know how to use Unix/Linux command line tools (from basics to ps, top, df, etc.)
- Ability to read shell scripts (and optionally Python, C)
Is This Training for Me?
I often get these questions. My answer is that if you like my blog and YouTube videos, you’ll like my training too! So, just browse around in the archives and see for yourself!
My Youtube channel has a bunch of informal hacking sessions. Mostly Oracle stuff in there so far, but you’ll see my style:
If you have further questions about this class, just send us an email!
Go to my new learning platform here:
