To capture your attention, this is what you get:

Table of contents
- What is xCapture?
- xCapture with modern eBPF
- Modular and decoupled at multiple levels
- Dimensional performance data analysis with DuckDB
- Top wall-clock time used by all threads
- Regular expressions in the filter
- Syscalls against network socket file descriptors
- What is the performance overhead?
- Performance overhead of active tracking probes
- Userspace processing overhead
- Running xcapture
- What’s next?
What is xCapture?
0x.tools is a suite of Linux performance & troubleshooting tools built with a preference for minimal dependencies and ease of installation across different Linux systems. It is not a product or a complicated platform that requires months of learning, planning and a SaaS subscription. It’s just a bunch of tools that I’ve first built for myself and the better ones get released, like xcapture today.
What is xcapture? It is an eBPF-based Linux thread activity measurement tool for systematic performance troubleshooting and optimization that can go very deep. It samples thread activity of all apps in your system, including Linux kernel threads. By activity I mean wall-clock time, not only CPU usage. I have also added event latency sampling for syscalls and IO requests so far. It is designed to run with a low overhead for advanced troubleshooting scenarios and with no direct overhead for basic usage. Yes you read that right! Read about passive sampling below.
xCapture v3 uses a method that I call “tracking plus sampling (not tracing)” of system thread activity. If you want to learn more about this method, watch my earlier talk videos from eBPF Summit (10 min), P99CONF (20 min) and a (60-minute) interview with Liz Rice at 0x.tools website.
xCapture with modern eBPF
The xcapture v3.0.0-alpha is a “nerd preview” release, just to show that this concept works and to let others play with it early. Full documentation, fewer bugs and the silver plate come later! I have designed and built this system with performance and efficiency in mind from the start, but I have not gotten to profile the tool itself or think about further optimizations. There are a lot of opportunities for optimization - after all, eBPF is not only configurable - it is fully programmable!
By “modern eBPF” I mean that I’m using libbpf with BTF & CO-RE, task iterators, task storage and many other eBPF features available in Linux kernels from version 5.14 and up. The v1 throw-away prototype that I showed a couple of years ago was using bpftrace that is not designed for building complex eBPF apps. I built the v2 using BCC, but half-way through it became evident that it would end up as a prototype as well. The “v0” has been around for over 20 years in the form of an ad-hoc “for loop” in Linux shell, sampling the /proc/PID/task/TID pseudofiles 1, or later, my Python tool psn 2.
Note that some distributors backport newer eBPF features back to their kernels, for example RedHat has ported the eBPF 6.8 subsystem to their 5.14 Linux kernel that ships with RHEL 9.5. 3
To understand the whole tracking plus sampling (not tracing) concept, I recommend you watch that 10-minute intro video from eBPF Summit I mentioned above. I haven’t documented it yet in text format, other than the code itself.
Ok, let’s proceed to showing you what I’ve built!
Modular and decoupled at multiple levels
I designed the whole project to be as decoupled and modular as possible. xCapture tracks and samples activity in the kernel and emits samples of threads “in states of interest” to userspace via an eBPF ringbuffer (another modern eBPF feature). I say “states of interest” because you don’t want to send 5000 idle threads’ information to userspace every time you take a sample, that would be too expensive.
By default, xcapture emits only samples for threads that are either running on CPU, trying to run on CPU (runqueue), waiting in Linux “D” scheduler state, or as a special case, sleeping in “S” state, while in an “io_getevents” syscall and it’s known that there’s at least one outstanding asynchronous I/O request submitted by that thread still going on. And that’s just the beginning :-)
As eBPF is programmable, you can define (program) any rule for deciding which thread is “active” (e.g. someone is waiting for it) vs. “idle”, sleeping with nothing to do at the moment. Currently I hardcoded these rules into my code, but I intend to build a more sophisticated rules engine and an ability to load your own eBPF “filter” programs for your custom application-specific decisions too.

Modular & decoupled also means that xcapture outputs plain CSV files with its thread samples and event completion records. Right now xcapture outputs its data to hourly CSV files - it’s trivial to compress and archive them or convert to Parquet in Python or DuckDB.
Dimensional performance data analysis with DuckDB
XCapture is designed to capture and emit dimensional records, where each sample acts like a row in a fact table in a dimensional data warehouse. Just the existence of a record in the xcapture_samples_*.csv files is a fact of this thread actively doing something in the server at sampling time. The context for that something is described by additional attributes in the thread samples file, like PID/TID, username, executable, state, syscall, filename accessed etc. These context attributes show up as additional fields in the output CSV file. Now you can do all kinds of slicing & dicing on this performance data, grouping, filtering, finding top this-and-that and search for outliers, etc.
DuckDB is the perfect choice for querying this data, it’s fast, local, reads CSV files automatically and has a very capable SQL query engine. Someday I will build a proper terminal tool on top of this data, but as a first step I wrote a small shell script xq (xCapture query) that reads any SQL file from the tools/sql/ directory, replaces some substitution variable placeholders in the SQL template with whatever I had passed in the command line and runs it in DuckDB. There’s no Python or anything complex involved, just a shell script, DuckDB and a bunch of CSV files.
A few examples are below, I won’t narrate them much here - I see a YouTube live-session coming!
Top wall-clock time used by all threads
Top wall-clock time spent in the chosen time range is shown in the SECONDS column. With many threads, you can spend more than one second per second doing something in aggregate, each thread has its own wall-clock time. As I know how wide time range we are looking at, I can normalize the total seconds value to AVG_THR for each group. In the chosen time range, the average number of threads actively doing what’s described in any group is SECONDS / (total_seconds_in_chosen_time_range).
- Grouped by thread state, executable name, syscall and block device name if relevant. You decide how to aggregate this data during query time, this “angle” is not hardcoded into eBPF.
- Show only thread samples that were in a syscall and the syscall name started with “p”
- Filter the time range to show activity between 14:38 and 15:20
- Oh, also show system call latency buckets for every group! Importantly, it estimates how much wallclock time your threads spent in system calls within these latency buckets, not just the number of system calls falling into a bucket (that would be misleading in this visualization).

Regular expressions in the filter
Easy thanks to DuckDB.

Syscalls against network socket file descriptors
Even in passive sampling mode, xcapture checks if a file descriptor that a thread’s syscall is currently working with has “socket info”. If yes, it’s not a regular file, but a socket pointing somewhere. With eBPF, it’s not hard to read whatever details you want from the socket_info struct. With active tracking mode, you’ll get syscall latencies too, of course.

What is the performance overhead?
In passive sampling mode, practically none! I mean, when you run ps or top in your system, you don’t really have to think about overhead, as both of these tools run in a separate single-threaded process and read (passively sample) various /proc files to get their data. They do not actively enable any new probes or tracepoints for other threads in the system. So, while top (and especially top -H) can consume quite a lot of CPU in their own process, it won’t make other tasks slower (as long as you have a little bit of idle CPU left). Thanks to eBPF, xcapture’s passive sampling mode is orders of magnitude more efficient than any of the /proc readers in userspace can ever be.
I use the bpftop tool by Netflix folks (thanks!) for keeping an eye on my active probes when developing and this is the output while running xcapture in passive sampling mode - only the eBPF task iterator-based sampling program is enabled, no active tracking probes attached to other threads.

By default, xcapture samples thread states once per second and from the “Events/sec” above I see that it has walked through 1368 threads (tasks) in the kernel memory. So I had 1368 total threads in that system at that moment, most probably idle (it was in a VM in my laptop).
The “Total Avg Runtime (ns)” above shows that examining a single thread in the kernel, deciding if it’s interesting and emitting a task sample to the eBPF ringbuf took a whole 126 nanoseconds on average! There are some fluctuations, in the latest bpftop screen refresh, the average was 284 nanoseconds per thread examined. That would be 1368 * 284 = 388,512 nanoseconds of (CPU) time spent by xcapture to get the latest snapshot of thread activity. That’s 388 microseconds, or 0.388 milliseconds of CPU time taken once per second! That’s why the “Total CPU%” metric in the top right corner above shows 0.04 percent of a single CPU taken by the passive sampler! This is not 0.04% of your total CPU capacity in the server, just 0.04% of a single CPU.
This is why I said “with no overhead” in the introduction and not “virtually no overhead” or something like that. Such eBPF-based passive sampling can be rolled out at scale, without having to worry about accidentally burning 10000 CPUs just for observability. Judging from their eBPF contributions, engineers at Meta are doing exactly that. 4
Performance overhead of active tracking probes
Active tracking, for seeing request latencies in addition to thread state samples, requires injecting eBPF tracepoints and probes that by definition end up on the critical path of the monitored threads in your system. You can choose which event types you want to track on xcapture command line (currently only syscalls and IO requests can be actively tracked). I have enabled both in this example:
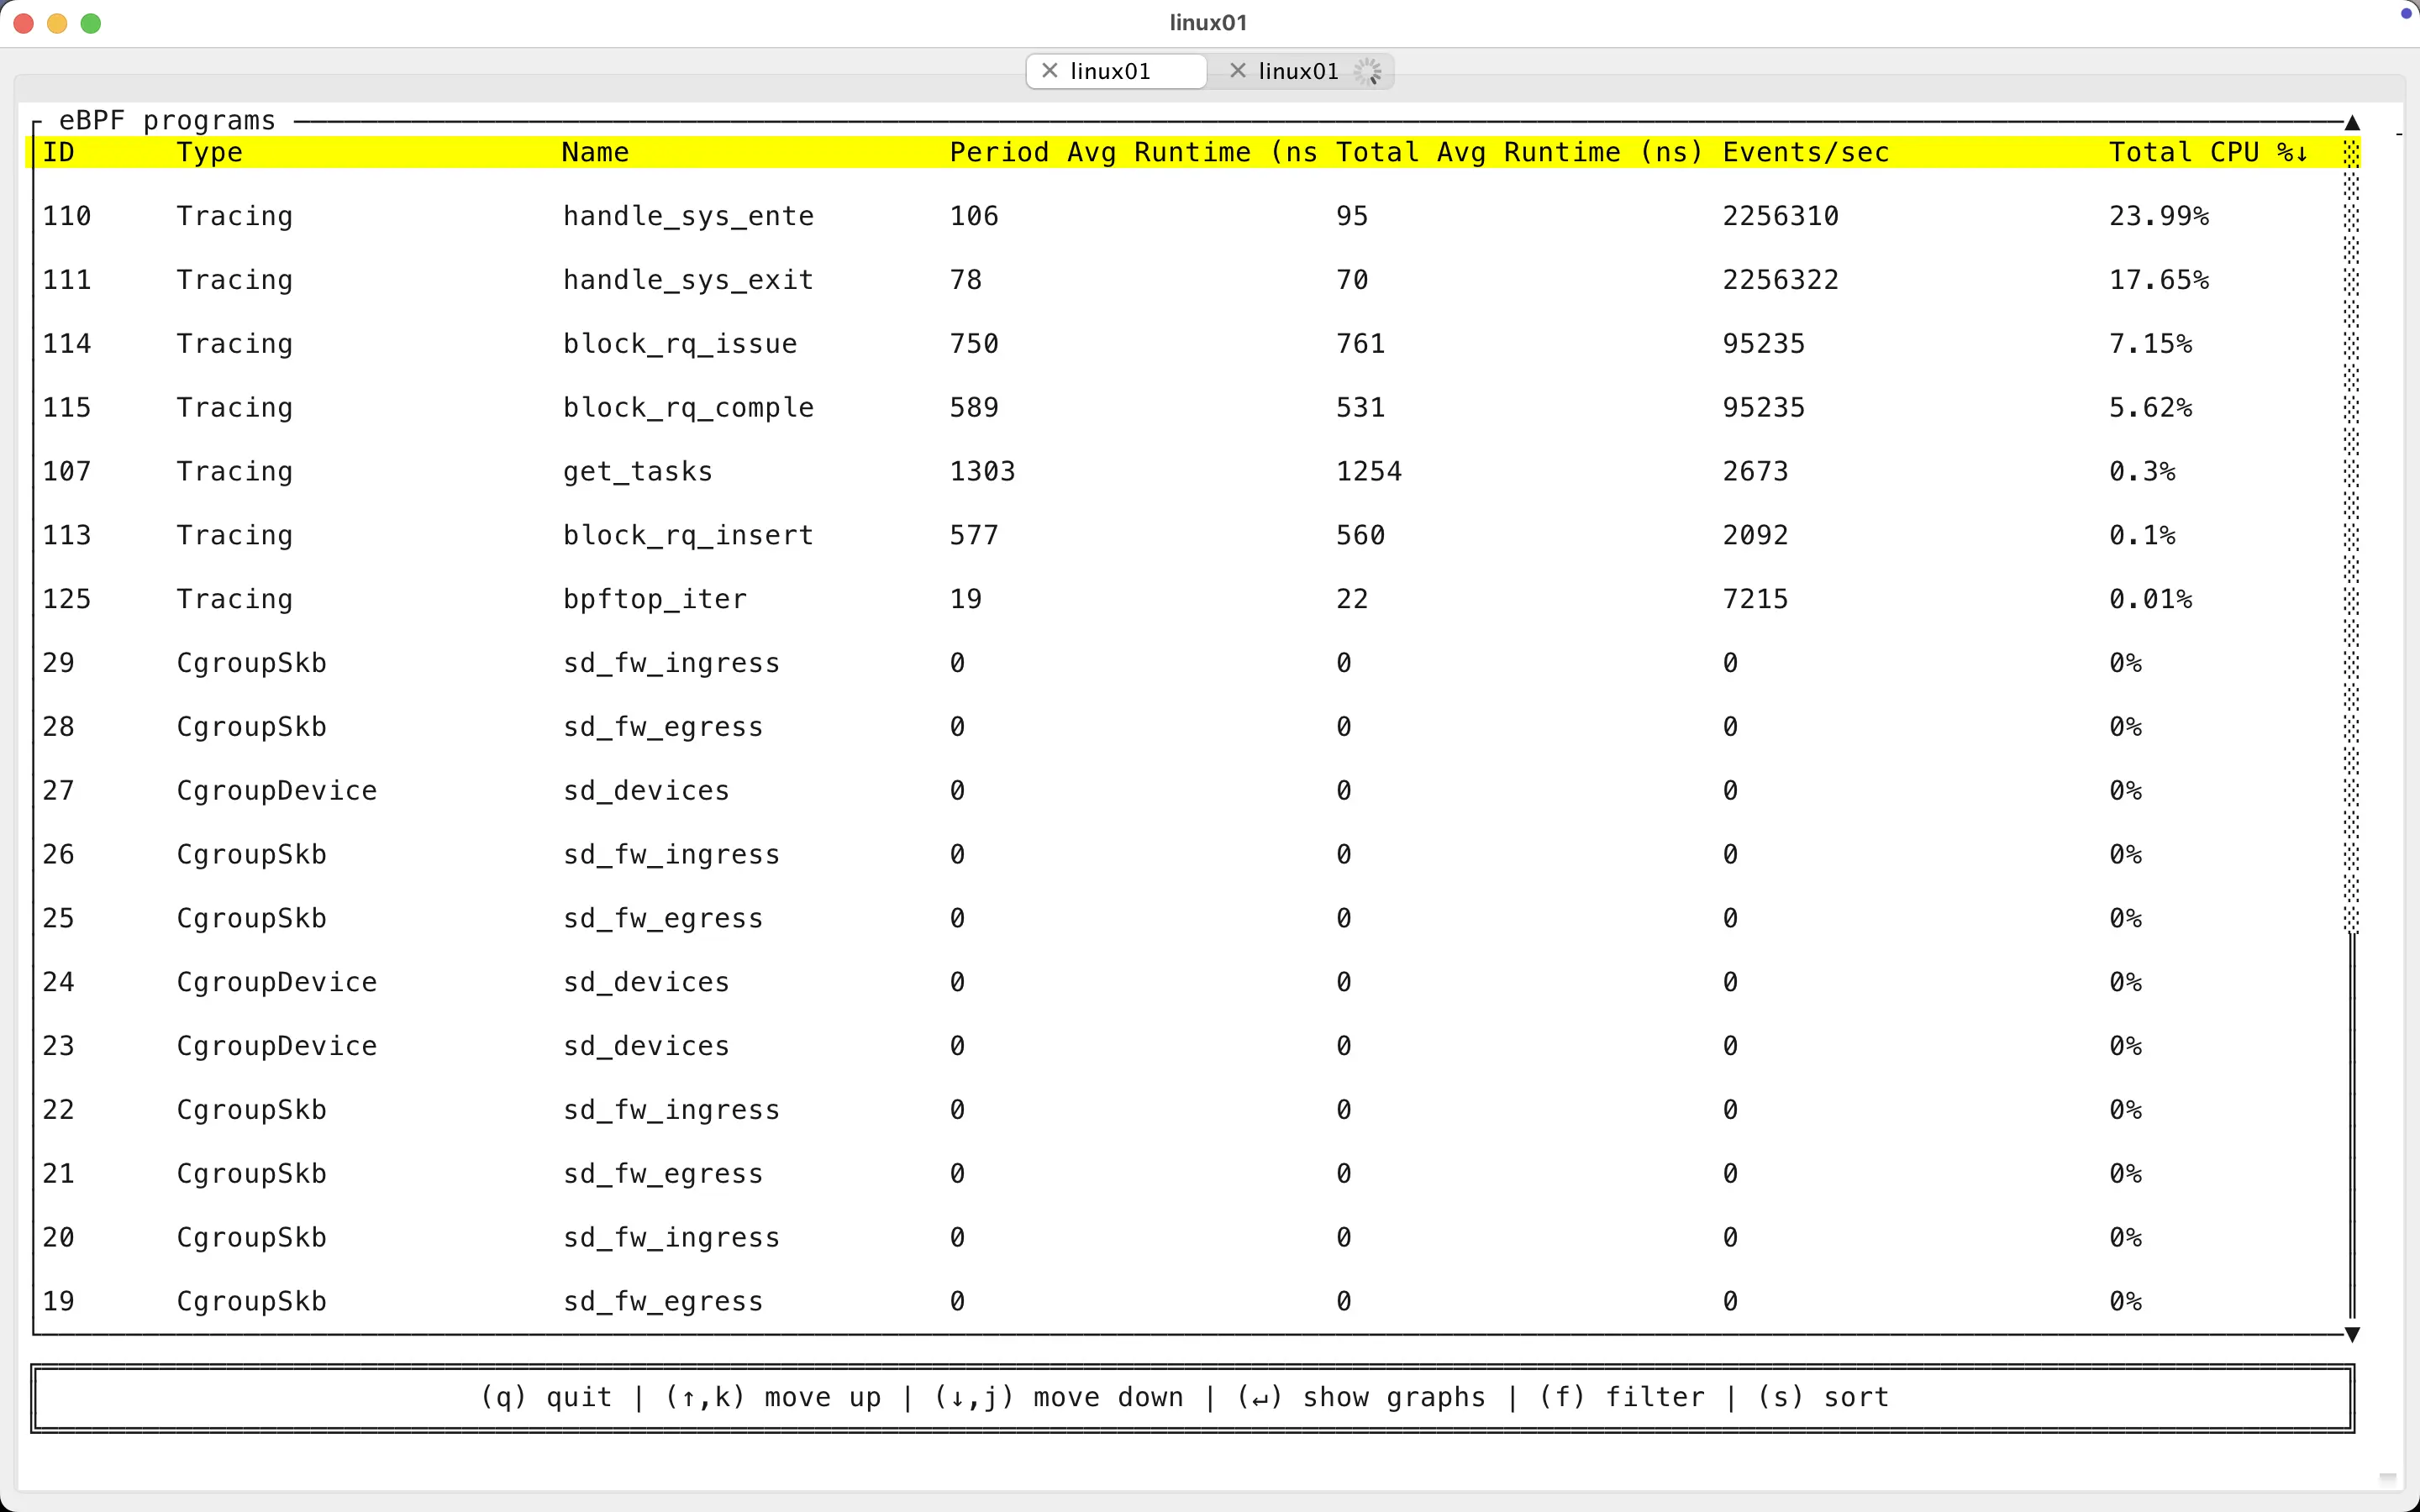
In the screenshot above you see that all threads in my system were issuing around 2.2M syscalls per second in aggregate. xcapture currently tracks all syscall types, but probably many less-interesting ones can be “ignored” in a future release. When tracking all syscalls of all threads on my 104 vCPU Intel Xeon machine, the probes added an overhead of 23.99% of a single CPU for syscall entry processing and 17.65% for syscall exits. This is with processing all 2.2M syscalls issued per second.
I was doing only 95k IOPS then, so while the current version of IO request tracking is slower than syscalls, we used additional 7.15% + 5.62% (of a single) CPU time for this. I have a number of ideas for how to greatly improve the IO request tracking efficiency too (one of them even works by now, it’s just too buggy for release).
The screenshot below shows the same system around the same time of running bpftop (above). You see the csw context switches metric is only about 1.1M (not 2.2M). This is because not every system call causes a sleep with a full context switch that takes your thread off CPU.

Userspace processing overhead
The xcapture eBPF code is of course (restricted) C that gets verified by the eBPF verifier on BPF program loading. The userspace frontend xcapture tool is also plain C as I didn’t want to learn Go or Rust just for this thin wrapper between my eBPF programs and CSV output. The modern libbpf framework does not have handy Python bindings like BCC does.
Here’s an example of running xcapture -a (emit all tasks regardless of their state) on a system with thousands of threads, don’t remember how many thousands. The red “eBPF” number on the right shows that every time the task iterator went through all tasks and emitted them to the ringbuf, it took about 4 ms in total. The left side shows that the total runtime of this xcapture loop that includes both the eBPF time and the userspace time of writing output to CSVs - about 10-14ms each time. This is not bad at all, even with thousands of threads!

Running xcapture
This is how I run it if I want passive sampling only:
$ sudo TZ=:/etc/localtime chrt -r 30 ./xcapture
I explain why the TZ and chrt priority settings are useful on the xcapture README section.
I just ran the passive sampling on my laptop’s Linux VM with just a few hundred threads in developer mode (output straight to STDOUT, not CSV):
$ sudo TZ=:/etc/localtime chrt -r 30 ./xcapture
TIMESTAMP                   OFF_US      TID     TGID  STATE   ON_CPU  ON_RQ   MIGP  USERNAME          EXE                   COMM              SYSC
2025-04-23T18:27:37.729704      23       17       17  RUN     0       1       0     root              [kernel]              ksoftirqd/0       -
2025-04-23T18:27:37.729704     165    36574    36574  RUN     0       1       0     root              [kernel]              kworker/0:1       -

Wall clock time: 2025-04-23T18:27:37.729659
Sampling took:   302 us (iter_fd: 201 us, inner: 196 us), sleeping for 999,697 us

TIMESTAMP                   OFF_US      TID     TGID  STATE   ON_CPU  ON_RQ   MIGP  USERNAME          EXE                   COMM              SYSC

Wall clock time: 2025-04-23T18:27:38.730919
Sampling took:   768 us (iter_fd: 717 us, inner: 637 us), sleeping for 999,231 us

TIMESTAMP                   OFF_US      TID     TGID  STATE   ON_CPU  ON_RQ   MIGP  USERNAME          EXE                   COMM              SYSC

Wall clock time: 2025-04-23T18:27:39.731761
Sampling took:   177 us (iter_fd: 158 us, inner: 132 us), sleeping for 999,822 us
Sampling takes just a few hundred microseconds on smaller systems. At that level, there are even noticeable fluctuations due to CPUs going into powersaving idle states and VM scheduling delays.
Here’s the xcapture --help output to show what kind of functionality is currently implemented:
$ ./xcapture --help

Usage: xcapture [OPTION...]
xcapture thread state tracking & sampling by Tanel Poder [0x.tools]

USAGE: xcapture [--help] [-o OUTPUT_DIRNAME] [-t TID] [-p PID]

EXAMPLES:
    xcapture              # output formatted text to stdout
    xcapture -F 20        # sample at 20 Hz
    xcapture -o /tmp/data # write CSV files to /tmp/data directory

  -a, --all                  Show all tasks including sleeping ones
  -F, --freq=HZ              Sampling frequency in Hz (default: 1)
  -k, --kallsyms-file=FILE   kallsyms file (default: /proc/kallsyms)
  -o, --output-dir=DIR       Write CSV files to specified directory
  -p, --passive              Allow only passive task state sampling
  -s, --stack-traces         Dump kernel stack traces to CSV files
  -t, --track=iorq,syscall   Enable active tracking with tracepoints & probes
  -T, --track-all            Enable all available tracking components
  -v, --verbose              Report sampling metrics even in CSV output mode
  -?, --help                 Give this help list
      --usage                Give a short usage message
  -V, --version              Print program version
What’s next?
- I expect it takes a couple of months for me to get this from a “nerd-alpha” version to a proper beta release
- Please try it out and feel free to raise issues in GitHub (I’m aware of plenty of bugs and shortcomings right now myself)
- Someday I’ll add a proper terminal-friendly tool xtop - top for wall-clock-time on top of all of this
- Next, I will put xcapture to test on my biggest server (2-socket EPYC NUMA machine with 384 CPUs) and blog about it (check out the screenshot below and look right!)

And finally
The 0x.tools repo and website are below (website has old v2 era info right now):
That’s all, thanks for reading!