Here’s part 3 of my xb.sql & xbi.sql article series that I started writing back in 2019 :-)
- Part 1 - Show and format execution plans by querying V$SQL_PLAN data directly
- Part 2 - Show plan line level “self-values” for A-Time and logical, physical I/Os
- Part 3 - Show plan line level cardinality misestimate factors (this article)
The importance of row-count (cardinality) estimates
When I look at complex enough SQLs and optimizer misbehavior, the optimizer cardinality estimates (E-Rows) are the most important optimizer numbers to follow in the execution plan, for understanding the optimizer choices. Of course for the actual execution metrics of the newly optimized plan, we’d look into A-Time, A-Rows, Starts, LIOs and PIOs as I’ve shown in previous posts. In this post, I’ll show how I walk through plans with bad cardinality misestimates and drill down into where those misestimates originate from.
This is a slide from my Oracle SQL tuning course that shows a conceptual diagram of the components and inputs involved in estimating a good plan for given optimizer inputs:

The diagram above shows the components and inputs involved, not the exact order of steps. The order depends on how the optimizer iterates through its search space (that can be seen in the CBO trace).
Close enough cardinality estimates are essential for any non-trivial SQL. After all, when the optimizer estimates that a driving table or a more complex row-source returns only 10 rows after its filtering, but the actual real rowcount coming from that row-source is 100k, you may end up doing some nested loop join lookup (+ index range scan) orders of magnitude more times than the optimizer planned and optimized for!
Both heavy overestimates and underestimates of row-counts can cause problems. The overestimates may drive you to full table scans instead of index usage and underestimates may leave you with excessive LIOs driven by nested loops or FILTER loops. Usually it’s a problem when the estimates are off by order(s) of magnitude, but this also depends on how the rest of the optimizer inputs look like. For example, if you end up with nested loops, but have great indexes that can handle even 1M nested loop join lookups efficiently, the query may still be running fast enough so that nobody complains :-)
Query examples with xb.sql showing cardinality misestimate factors
Here’s an example of a demo query I use for showing some of the complexities the optimizer may endure:
SELECT /*+ GATHER_PLAN_STATISTICS */
    c.customer_id
  , c.account_mgr_id
  , c.credit_limit
  , o.order_total
FROM
    soe.customers c
  , soe.orders o
WHERE
-- join conditions
    o.customer_id = c.customer_id
AND o.order_total > 2 * c.credit_limit
-- filter conditions
AND c.account_mgr_id IN (73, 75, 54)
AND (c.customer_since < TO_DATE('2010-01-01', 'YYYY-MM-DD') OR c.customer_class = 'Business')
Here’s the usual execution plan, showing that the optimizer converted the IN (73, 75, 54) condition above into an INLIST ITERATOR loop (line #3) that just does a separate index range scan under it for each value in its inlist. Since we had 3 values in the inlist, the Starts = 3 for line #4 under that inlist iterator.
SQL_ID  7muc7uq7nx6ru, child number 0

----------------------------------------------------------------------------------------------------------------------------
| Id  | Operation                              | Name                    | Starts | E-Rows | A-Rows | Buffers | Cost (%CPU)|
----------------------------------------------------------------------------------------------------------------------------
|   0 | SELECT STATEMENT                       |                         |      1 |        |    136 |    3900 |  1353K(100)|
|   1 |  NESTED LOOPS                          |                         |      1 |  50912 |    136 |    3900 |  1353K  (1)|
|   2 |   NESTED LOOPS                         |                         |      1 |    622K|   1506 |    2394 |  1353K  (1)|
|   3 |    INLIST ITERATOR                     |                         |      1 |        |    580 |     643 |            |
|*  4 |     TABLE ACCESS BY INDEX ROWID BATCHED| CUSTOMERS               |      3 |    207K|    580 |     643 |   253K  (1)|
|*  5 |      INDEX RANGE SCAN                  | CUST_ACCOUNT_MANAGER_IX |      3 |    297K|    630 |      13 |   641   (1)|
|*  6 |    INDEX RANGE SCAN                    | ORD_CUSTOMER_IX         |    580 |      3 |   1506 |    1751 |     3   (0)|
|*  7 |   TABLE ACCESS BY INDEX ROWID          | ORDERS                  |   1506 |      1 |    136 |    1506 |     6   (0)|
----------------------------------------------------------------------------------------------------------------------------

   4 - filter(("C"."CUSTOMER_SINCE"<TO_DATE(' 2010-01-01 00:00:00', 'syyyy-mm-dd hh24:mi:ss') OR "C"."CUSTOMER_CLASS"='Business'))
   5 - access(("C"."ACCOUNT_MGR_ID"=54 OR "C"."ACCOUNT_MGR_ID"=73 OR "C"."ACCOUNT_MGR_ID"=75))
   6 - access("O"."CUSTOMER_ID"="C"."CUSTOMER_ID")
   7 - filter("O"."ORDER_TOTAL">2*"C"."CREDIT_LIMIT")
The E-Rows vs A-Rows values above show a pretty big discrepancy, but the units of these columns are not the same! The E-Rows is the optimizer’s cardinality estimate per Start and A-Rows is the total number of rows (returned to parent by this rowsource) across all Starts. As long as the Starts = 1 for a rowsource, you can compare E-Rows and A-Rows directly.
Update: I just fixed a “bug” in my explanation in the paragraph below, I had taken a number from the wrong, Buffers column instead of A-Rows for plan line #7 explanation, when writing up this post last night :-)
But if you look into the last plan line #7, the Starts = 1506, E-Rows = 1 and A-Rows = 136. This means we did 1506 table lookups using ROWIDs retrieved from an index, but most of them got filtered out right after that (filter("O"."ORDER_TOTAL">2*"C"."CREDIT_LIMIT")). That’s why only 136 rows were actually sent up to the parent operation in the plan. If we compare the Starts * E-Rows to A-Rows, we see that 1506 is about 11x bigger than the actual 136 rows produced - 11x cardinality overestimate.
This can get more complicated with bigger plans and larger Starts numbers (looping in the plan) and that’s why I added this simple math to my xb.sql/xbi.sql scripts, with a basic “Optimizer cardinality misestimate factor” calculated field.
I took the SQL_ID of the previous plan and ran xbi.sql (eXplain Better by SQL_ID). I made the output much narrower to focus only on the cardinality and row-counts:
SQL> @xbi 7muc7uq7nx6ru 0
-- xbi.sql: eXplain Better v1.01 for sql_id=7muc7uq7nx6ru child=0 - by Tanel Poder (https://tanelpoder.com)

 Pred    Op                                                       Rowsource  Real #rows  Est. rows   Opt. Card.
 #Col    ID Row Source                                               starts    returned      total  misestimate
----- ----- ---------------------------------------------------- ---------- ----------- ---------- ------------
          0 SELECT STATEMENT                                              1         136
          1  NESTED LOOPS                                                 1         136      50912         374x
          2   NESTED LOOPS                                                1        1506     622869         414x
          3    INLIST ITERATOR                                            1         580
    F     4     TABLE ACCESS BY INDEX ROWID BATCHED [CUSTOMERS]           3         580     622869        1074x
  A#1     5      INDEX RANGE SCAN [CUST_ACCOUNT_MANAGER_IX]               3         630     891405        1415x
  A#1     6    INDEX RANGE SCAN [ORD_CUSTOMER_IX]                       580        1506       1740           1x
    F     7   TABLE ACCESS BY INDEX ROWID [ORDERS]                     1506         136       1506          11x

   Op
   ID   Predicate Information (identified by operation id):
------------------------------------------------------------------------------------------------------------
    4 - filter(("C"."CUSTOMER_SINCE"<TO_DATE(' 2010-01-01 00:00:00', 'syyyy-mm-dd hh24:mi:ss') OR
        "C"."CUSTOMER_CLASS"='Business'))
    5 - access(("C"."ACCOUNT_MGR_ID"=54 OR "C"."ACCOUNT_MGR_ID"=73 OR "C"."ACCOUNT_MGR_ID"=75))
    6 - access("O"."CUSTOMER_ID"="C"."CUSTOMER_ID")
    7 - filter("O"."ORDER_TOTAL">2*"C"."CREDIT_LIMIT")
Now it is a little bit easier to navigate to the row source(s) where the initial cardinality misestimate originates from. I walked the plan to the “deepest” rowsource in the plan tree (#5, INDEX RANGE SCAN with cardinality overestimate 1415x). If you walk back upwards to its parent and grandparent operations (1074x, 414x, 374x overestimate) - these misestimates are likely “victims” of the original cardinality misestimate deeper down.
So the next step here would be to see what the plan line #5 is doing then, what filter/access predicates it has (see #5 above). Are we filtering using some (implicit datatype conversion) functions or CASE expressions that the optimizer can’t reason about - and what kind of stats does this specific column have on it.
In my case, the predicates are OK, just 3 inlist-iterations with exact equality searches comparing numbers to numbers with an index, but the heavy cardinality overestimate comes from how the hybrid histograms work with the current shape of the data in the filtered column. I recently blogged about it.
My actual problem that led me to finally write this article happened when I ran the same query with 5 elements in that INLIST:
AND c.account_mgr_id IN (73, 75, 54, 42, 45)
Pretty much the same query, right, but it ran much slower and gave a different plan. I ran just @xb this time, to report the previous query execution plan in the current session (without having to specify the SQL_ID):
SQL> @xb
-- xb.sql: eXplain Better v1.01 for prev SQL in the current session - by Tanel Poder (https://tanelpoder.com)

 Pred    Op                                                      Rowsource  Real #rows     Est. rows  Opt. Card.
 #Col    ID Row Source                                              starts    returned         total misestimate
----- ----- --------------------------------------------------- ---------- ----------- ------------- -----------
          0 SELECT STATEMENT                                             1         153
   FA     1  HASH JOIN                                                   1         153         84853        555x
          2   INLIST ITERATOR                                            1         690
    F     3    TABLE ACCESS BY INDEX ROWID BATCHED [CUSTOMERS]           5         690       1730195       2508x
  A#1     4     INDEX RANGE SCAN [CUST_ACCOUNT_MANAGER_IX]               5         780       2476130       3175x
          5   TABLE ACCESS FULL [ORDERS]                                 1   272101067     272101067          1x

   Op
   ID   Predicate Information (identified by operation id):
------------------------------------------------------------------------------------------------------------
    1 - access("O"."CUSTOMER_ID"="C"."CUSTOMER_ID")
    1 - filter("O"."ORDER_TOTAL">2*"C"."CREDIT_LIMIT")
    3 - filter(("C"."CUSTOMER_SINCE"<TO_DATE(' 2010-01-01 00:00:00', 'syyyy-mm-dd hh24:mi:ss') OR
        "C"."CUSTOMER_CLASS"='Business'))
    4 - access(("C"."ACCOUNT_MGR_ID"=42 OR "C"."ACCOUNT_MGR_ID"=45 OR "C"."ACCOUNT_MGR_ID"=54 OR
        "C"."ACCOUNT_MGR_ID"=73 OR "C"."ACCOUNT_MGR_ID"=75))
The optimizer has chosen to do a full table scan with a hash join this time, because its estimated Cost for doing 5 INLIST ITERATOR index range scans (plus related table block visits) ended up bigger than just doing a full table scan with a hash join.
Since it’s the cardinality that greatly affects optimizer cost calculations in complex plans, we shouldn’t be wondering about optimizer cost here (optimizer’s output), but cardinality calculations based on optimizers inputs. So we’d be asking the question how to give Oracle better cardinality estimates here. And that’s why we have so many optimizer cardinality adjustment related features these days (SQL profiles, statistics feedback, adaptive query execution features and some stats gathering functionality too).
I sometimes use the CARDINALITY hint when in troubleshooting mode, to see whether the optimizer would automatically do the right thing, if it somehow were able to estimate the row-counts correctly.
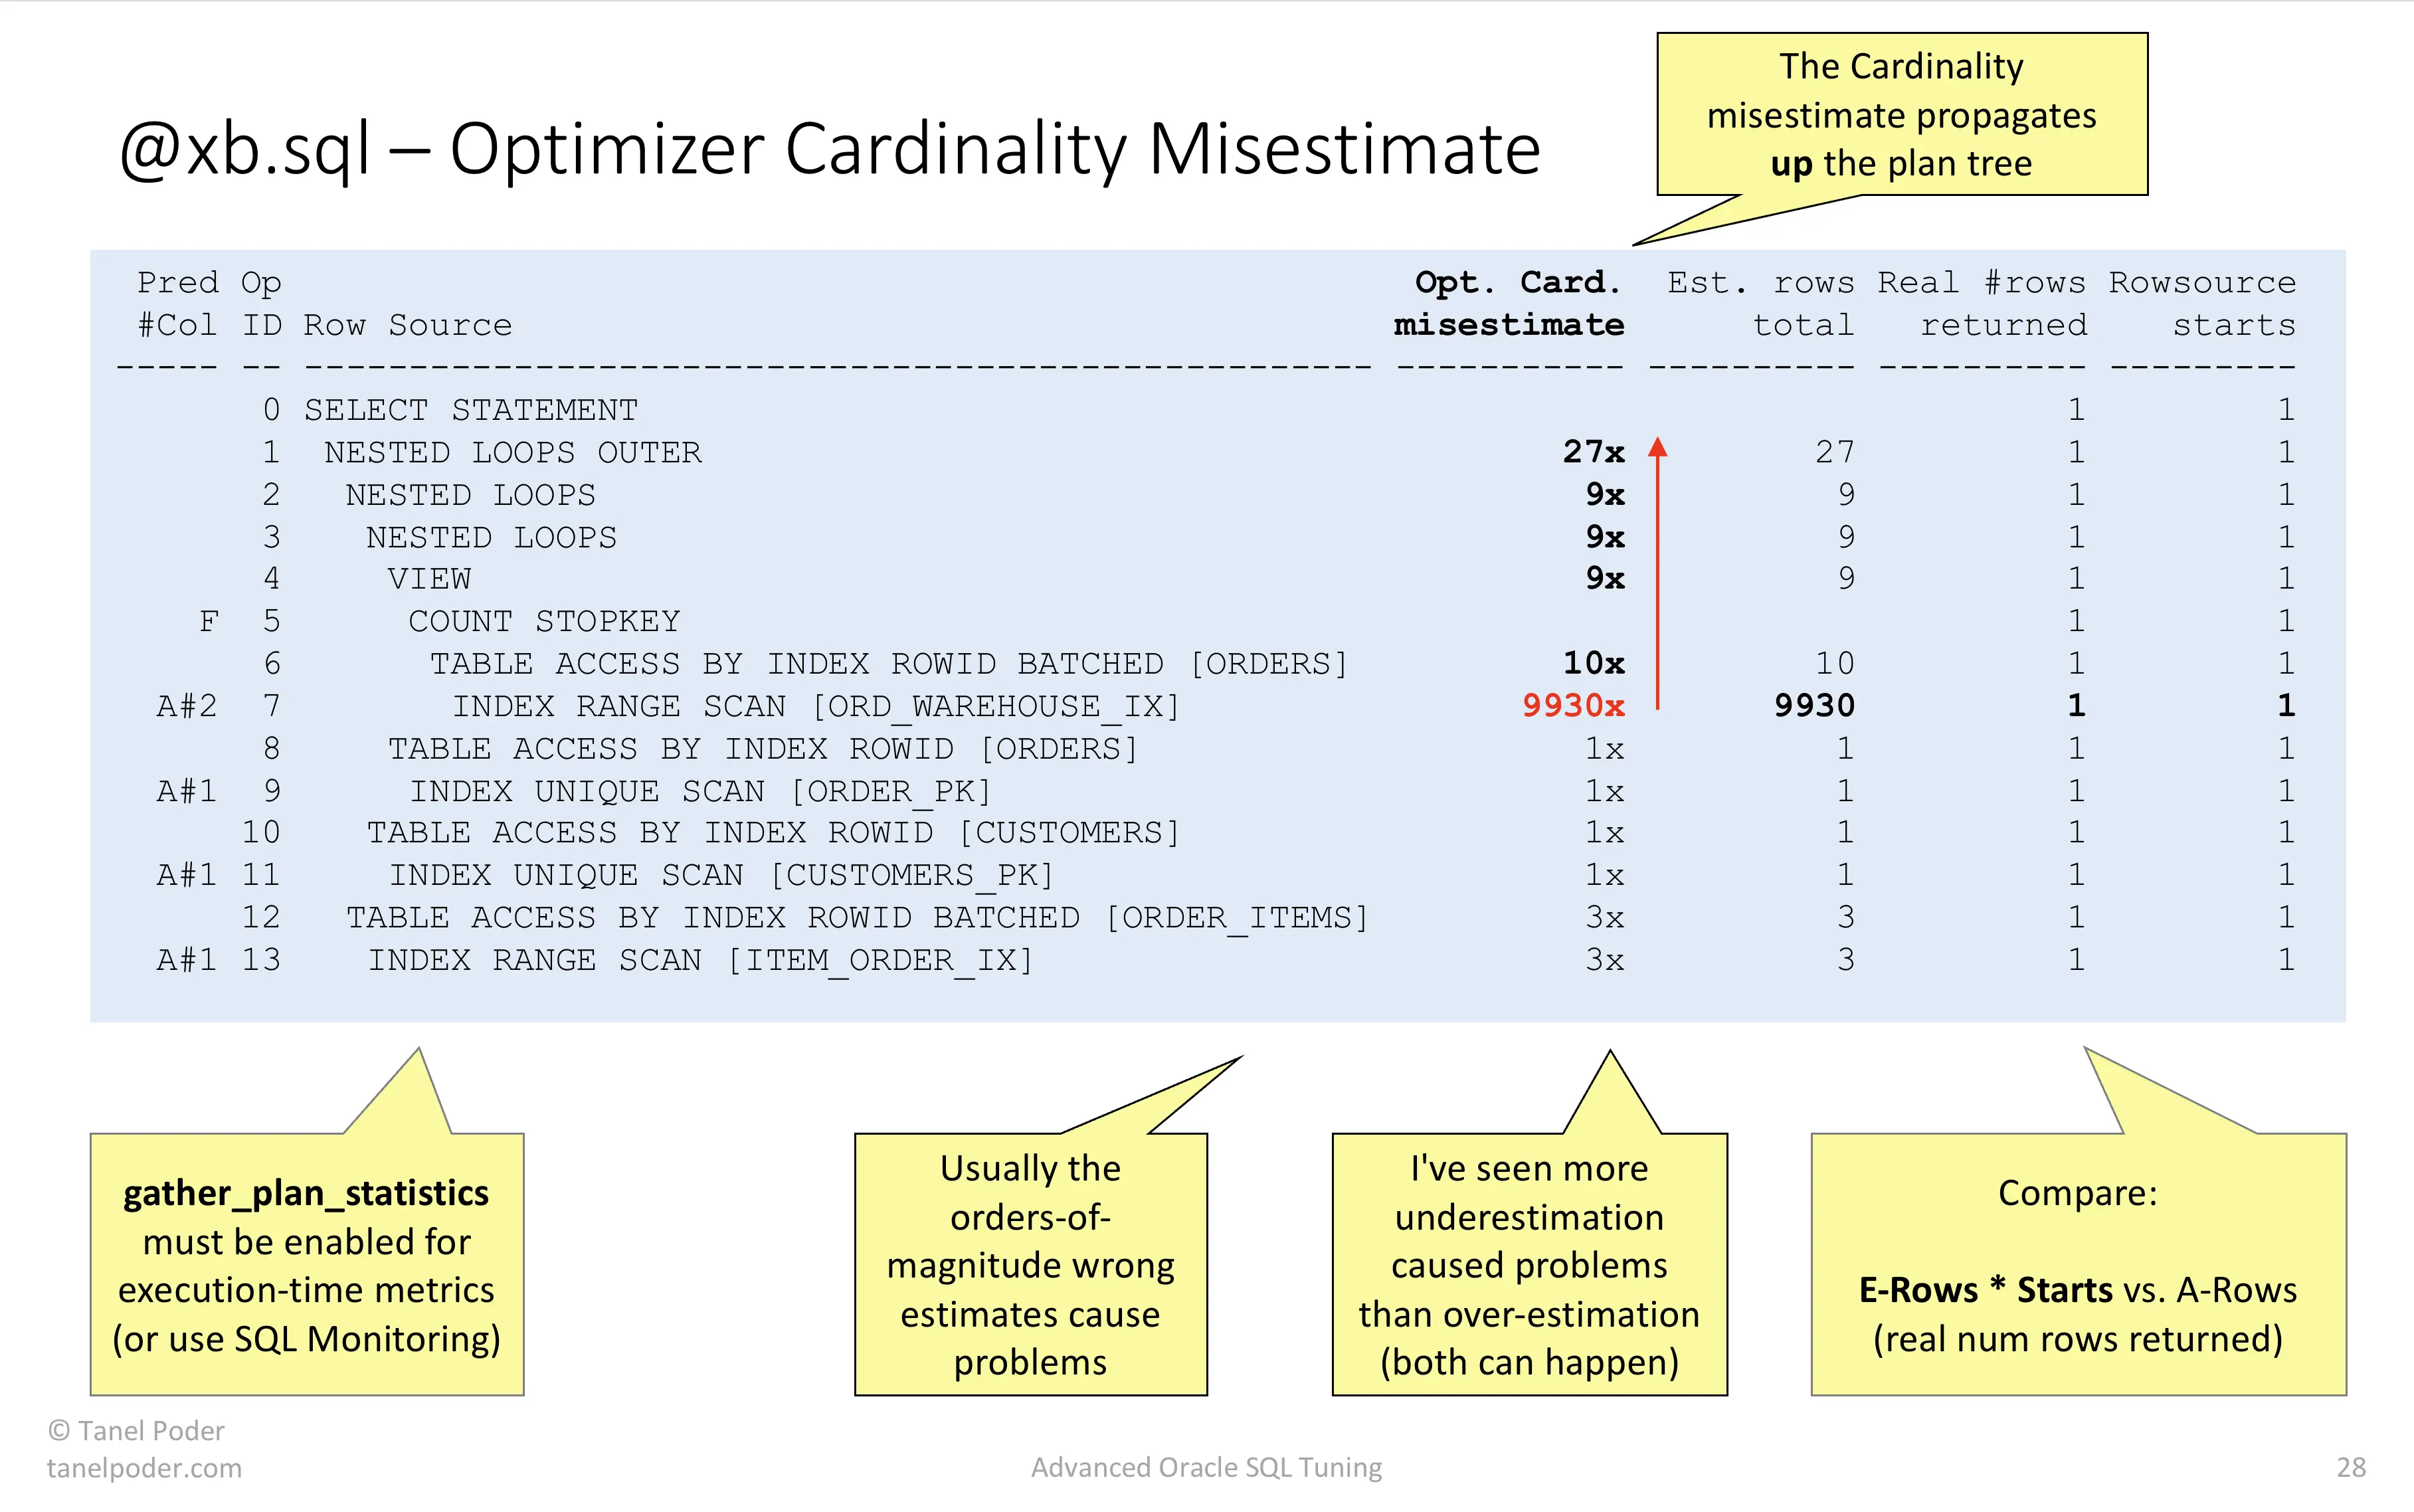
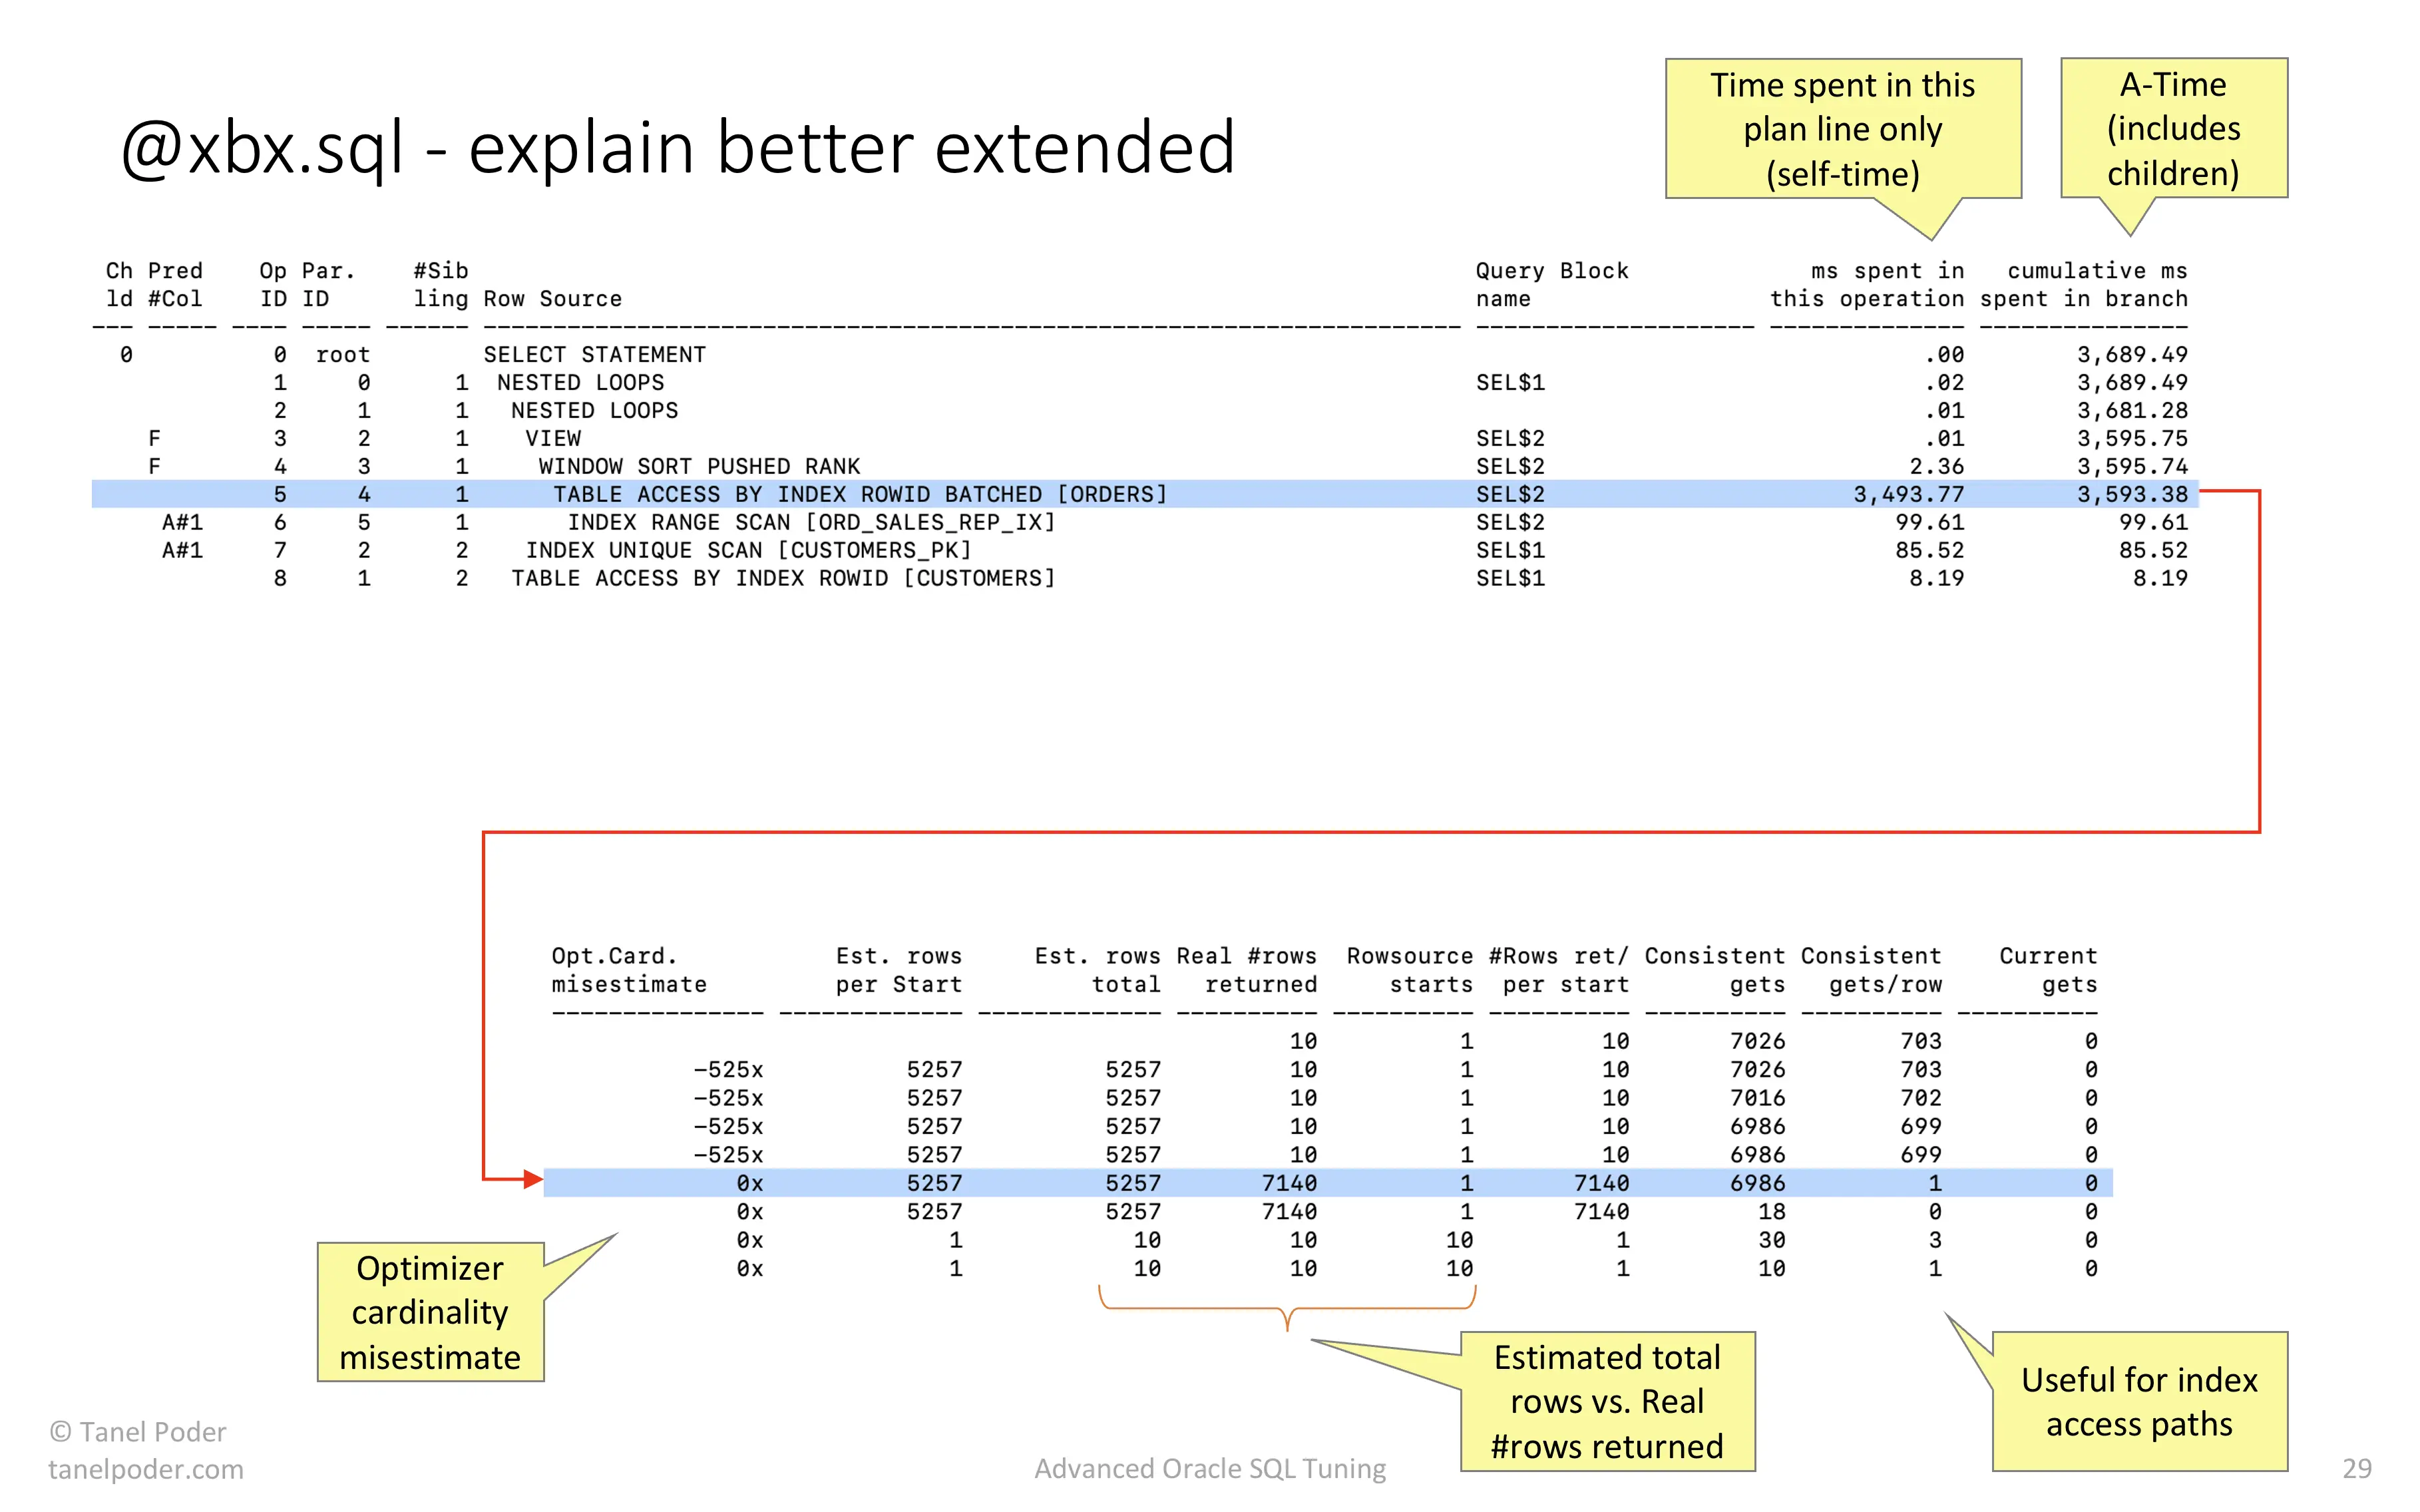
There’s plenty of more to say about this topic, but it’s also time to go to sleep, so I’ll leave you with two more screenshots to interpret yourself (the first is an overestimate, the second is an underestimate):
Cardinality overestimate
Start from the deepest misestimate and walk up from there:
Cardinality underestimate
In this case the deepest parts of the plan had good estimates, but something went wrong at plan line #4 - WINDOW SORT PUSHED RANK. This can happen due to optimizer bugs too, including estimating Cardinality = 1 for large row-sources!
Thanks for reading!