An interactive demo video is here: Part 2.
If you already know what embeddings are, you can jump right to:
Background
I am currently testing various RDBMS vector search options and their usability & performance. Next week I will publish an early version of my CatBench toolset that will eventually evolve into a full end-to-end test (and fun!) suite for high performance AI/ML pipelines, with things like streaming image recognition using Vision Transformers on GPUs, followed by vector searches in target databases and more.
I decided to build CatBench so that there would be a nice and not-too-serious way to test out all the components of the pipeline, without trying to get into domain specific use cases like fraud detection or retail recommendation engines. My main interest is to test, measure and optimize all the hardware/software interactions and eventually add fancier things like RDMA, GPUDirect and other things into the mix.
However, this post is a prequel to next week’s big launch! There’s an abundance of articles that explain how a vector search works, distance metrics and how to use SQL commands to create tables with vector datatypes and then query them. But I have received this question before:
What the heck is a vector?
The immediate answer you can get by searching is that a typical vector is just an array of (often 768 or 1000) elements, each containing a 4-byte floating point value. And you can store these in a database, index them with vector indexes and query distance (similarity) between different vectors stored in your tables. So, a VECTOR(1000) datatype in Postgres would take about 4kB of space, before any overhead or indexing. But what do all these 1000 values (dimensions) in a vector represent? How do vectors work? Where do they come from?
Instead of repeating all the existing answers already out there, I thought to apply a pretty simple visualization to some of these vectors, specifically the 25000 pet images in the Kaggle Cat/Dog dataset and optionally 10000 aircraft images too. The following content will not answer all the questions and also relies on some pretty loose analogies, but hopefully helps people to get an intuitive understanding of roughly what they are!
Where do vectors come from?
Before I show you the visualization, a super-terse summary of the full picture:
- Embedding vectors are generated by programs running on GPUs or CPUs, using machine learning models like the PyTorch Vision Transformer in my code. I feed in cat photos for “image recognition” and get vectors (of embeddings) back!
- These machine learning models are usually built and trained by large tech firms (Google, Meta, etc), AI startups or research institutions.
- Training takes a lot of time, input data, GPUs and money! Some of the model output weights from training are freely downloadable by us mere mortals - or you can skip this whole part and use some vendor’s APIs to access models hosted by them.
- Now we can pick a model that’s suitable for our task in hand (image recognition, language, etc) and start feeding relevant data (cat photos!) into it and get the 4kB sized “fingerprints” back in form of embeddings, that are arrays/vectors of real numbers (floats).
- This fingerprinting work (machine learning inference) can happen on CPUs or GPUs, often in small specialized devices at the edge of your network, so you don’t have to send all that high-bandwidth raw video or other signal data to your servers.
- Once the fingerprint is sent to your (database) servers, you can now perform vector similarity searches against your existing vector data for various use cases, like the fraud or anomaly detection mentioned above.
This probably still didn’t give you an intuitive understanding of what the heck a vector is and how it can be used in similarity searches, so let’s visualize them!
Visualizing Embedding Vectors as HeatMaps
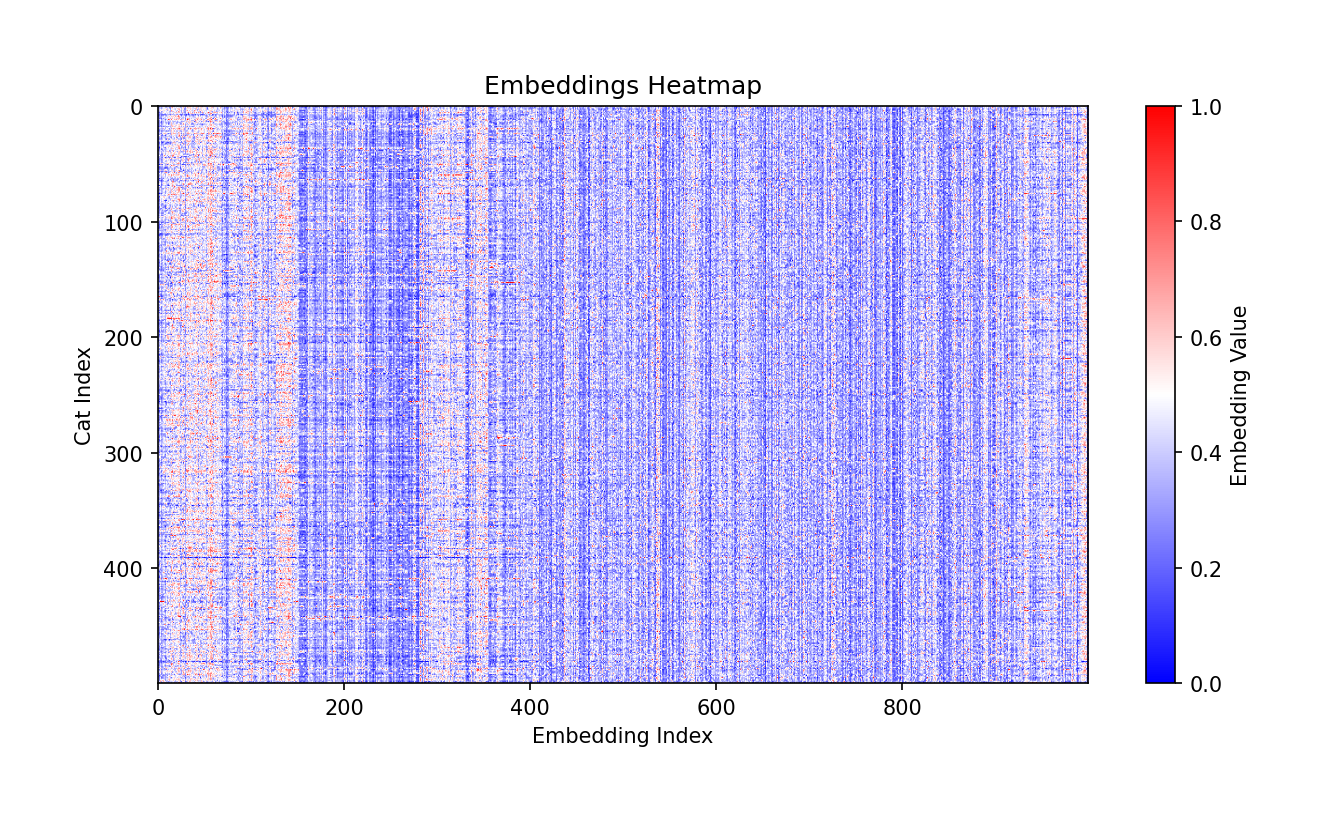
Let’s first visualize some vectors that I had previously computed using the CatBench generate_embeddings.py script with PyTorch on a GPU, using the pretrained PyTorch->TorchVision->ViT_B_16->ImageNet1K_V1 model. PyTorch automatically downloaded the model files needed for this for me on first invocation. Here’s an example of what 500 embedding vectors of cat pictures look like in text format (5MB). First I’ll show you the statically generated images, an interactive demo follows as a YouTube video!
If a vector is just an array of 1000 numbers, we can plot them out as a line of 1000 pixels and use each element’s value as the pixel’s color on a spectrum!
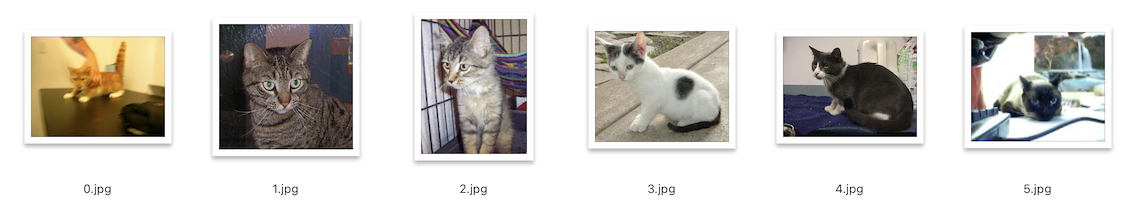
Printing out a single thin line would not be so interesting, so I picked the first 500 cats from Kaggle’s 25k pet image dataset and plotted all of them out under each other. The X axis (columns) show each element’s value in a respective cat’s vector, using a temperature-like color, where blue is the lowest (negative) value, red is the highest value and white is close to zero.
On the Y-axis (rows) we have embeddings from 500 different cat photos (Cat Index: 500 lines/pixels reading from top down). Each line (row) is a separate cat, fingerprinted using the same “algorithm”! On the X-axis (columns) we have the embedding values computed for each cat. Since my embedding vectors have 1000 elements each, the output heatmap is 1000 pixels wide.
As you see, it’s not random! We definitely do see patterns here! To our eyes, it looks like mostly top down lines, with few “disturbances” and outliers. This makes sense. If the ML model was designed to recognize features from images, not just count raw pixels, and all 500 photos are of cats, it would be expected to see similar outputs for all 500 inputs that all look similar to the “AI eyes” :-)
What exactly these individual numbers/colors mean is not important for now - they’re just part of the “fingerprint”, results of inference through the machine learning model I downloaded. Different ML models will produce different numbers that will make sense only for that model (or structurally similar ones). You can think of it like compiling your C source code for different architectures, x86, RISC and ARM… the resulting binaries make sense only for the CPUs a binary was intended for!
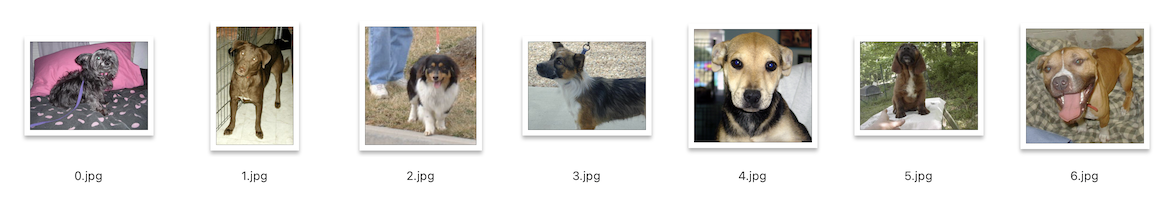
Without going too much more into details, let’s now look into dogs! We have 12.5k cat and 12.5k dog photos, after all! I took 500 dog pictures and generated “fingerprints” (embeddings) for them and plotted a static heatmap:
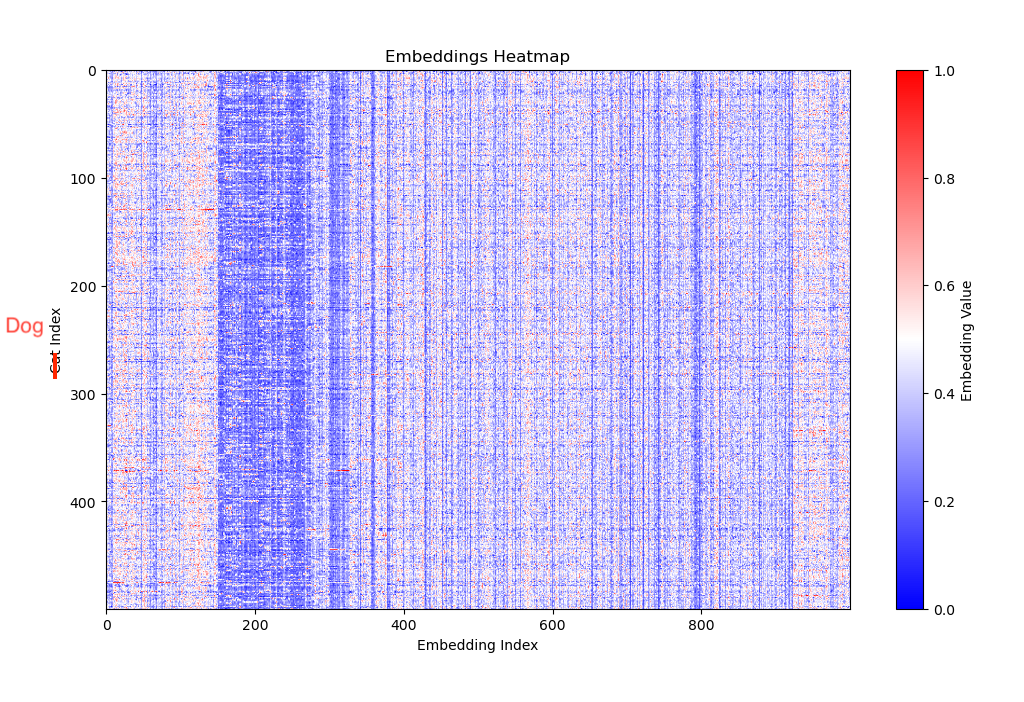
Seems similar, but when you scroll up and down (or open two browser windows), you’ll see that there are differences in the vertical “bands” of the heatmap! (somewhere between 180-350 on the X axis - embedding index, the slot number of each pet’s embedding array).
The obvious next thing to do is to compare these pics right side-by-side, or actually on top of each other to see how many vertical bands do not match, but why not add airplanes to the picture too!

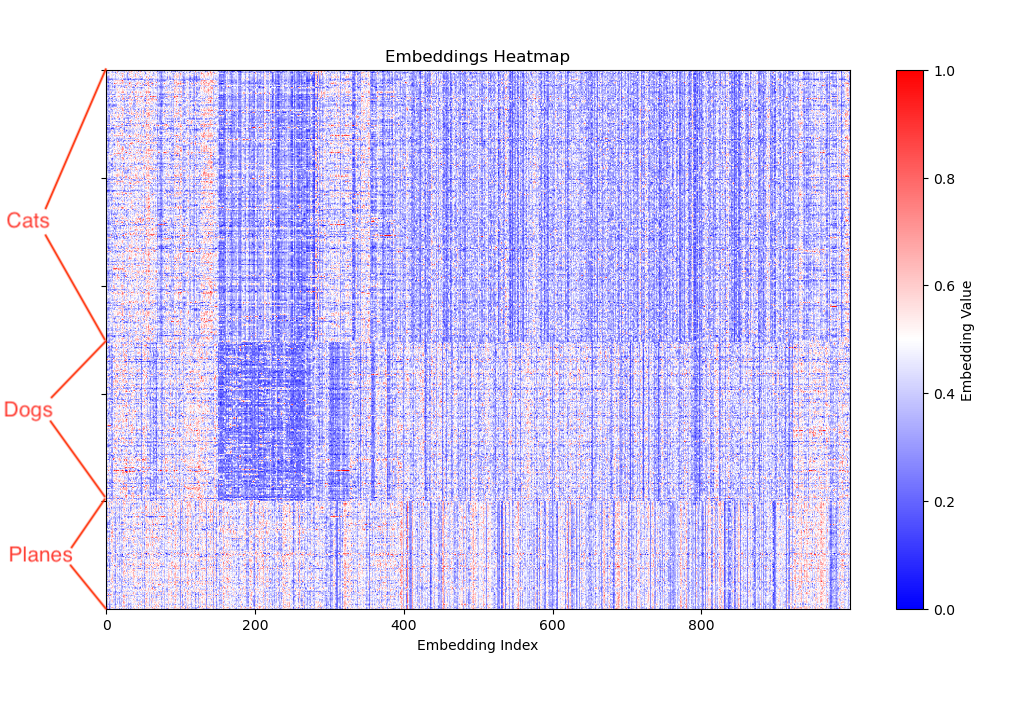
Now it should be really visible what these vectors are about. As I said in the beginning, this post will not give you all the answers, but it does illustrate that vectors are multidimensional (1000-dimensions in my case) data structures, that “compress”, reduce, encode a meaning that’s higher than just pixels, into a 1000-slot array. And how the ML model is built and trained, defines what this meaning means.
An embedding vector is an array of values (floats) where each value encodes a feature, relationship or a higher level “meaning” across the whole training dataset. It is a sophisticated “fingerprint” of its original input.
I have published two demo videos of the interactive (CatBench) vector visualization app here:
Stay tuned and subscribe/follow if you want to hear more! (You can install the interactive app from GitHub!)
Update 1: Quanta Magazine has published a nice short article summarizing what embeddings are (without getting deep into technical details).
Update 2: Quanta Magazine has published an illustrated guide How Can AI ID a Cat?.