Hands-on technical analysis of a novel data platform for high-performance block I/O in the cloud,
tested by Tanel Poder, a database consultant and a long-time computer performance nerd.
Index
- Background and motivation
- Scalable Architecture by Design
- Enterprise Features
- Testing Results
- I/O Latency
- 1.3 Million IOPS
- Lessons Learned
- Summary
Background and Motivation
Back in 2021, my old friend Chris Buckel (@flashdba) asked me if I would like to test out the Silk Data Platform in the cloud and see how far I could push it. And then write about it. We got pretty nice results, 5 GiB/s IO rate to the Silk backend just from a single cloud VM.
Three years later, networks have gotten faster, and Chris pinged me saying they can now achieve over 20 GiB/s I/O read rate (and over 10 GiB/s sustained writes) against Silk data volumes from a single client VM! When he asked if I would like to test the platform again - I sure was interested, I like to play with cool technologies that enable new things.
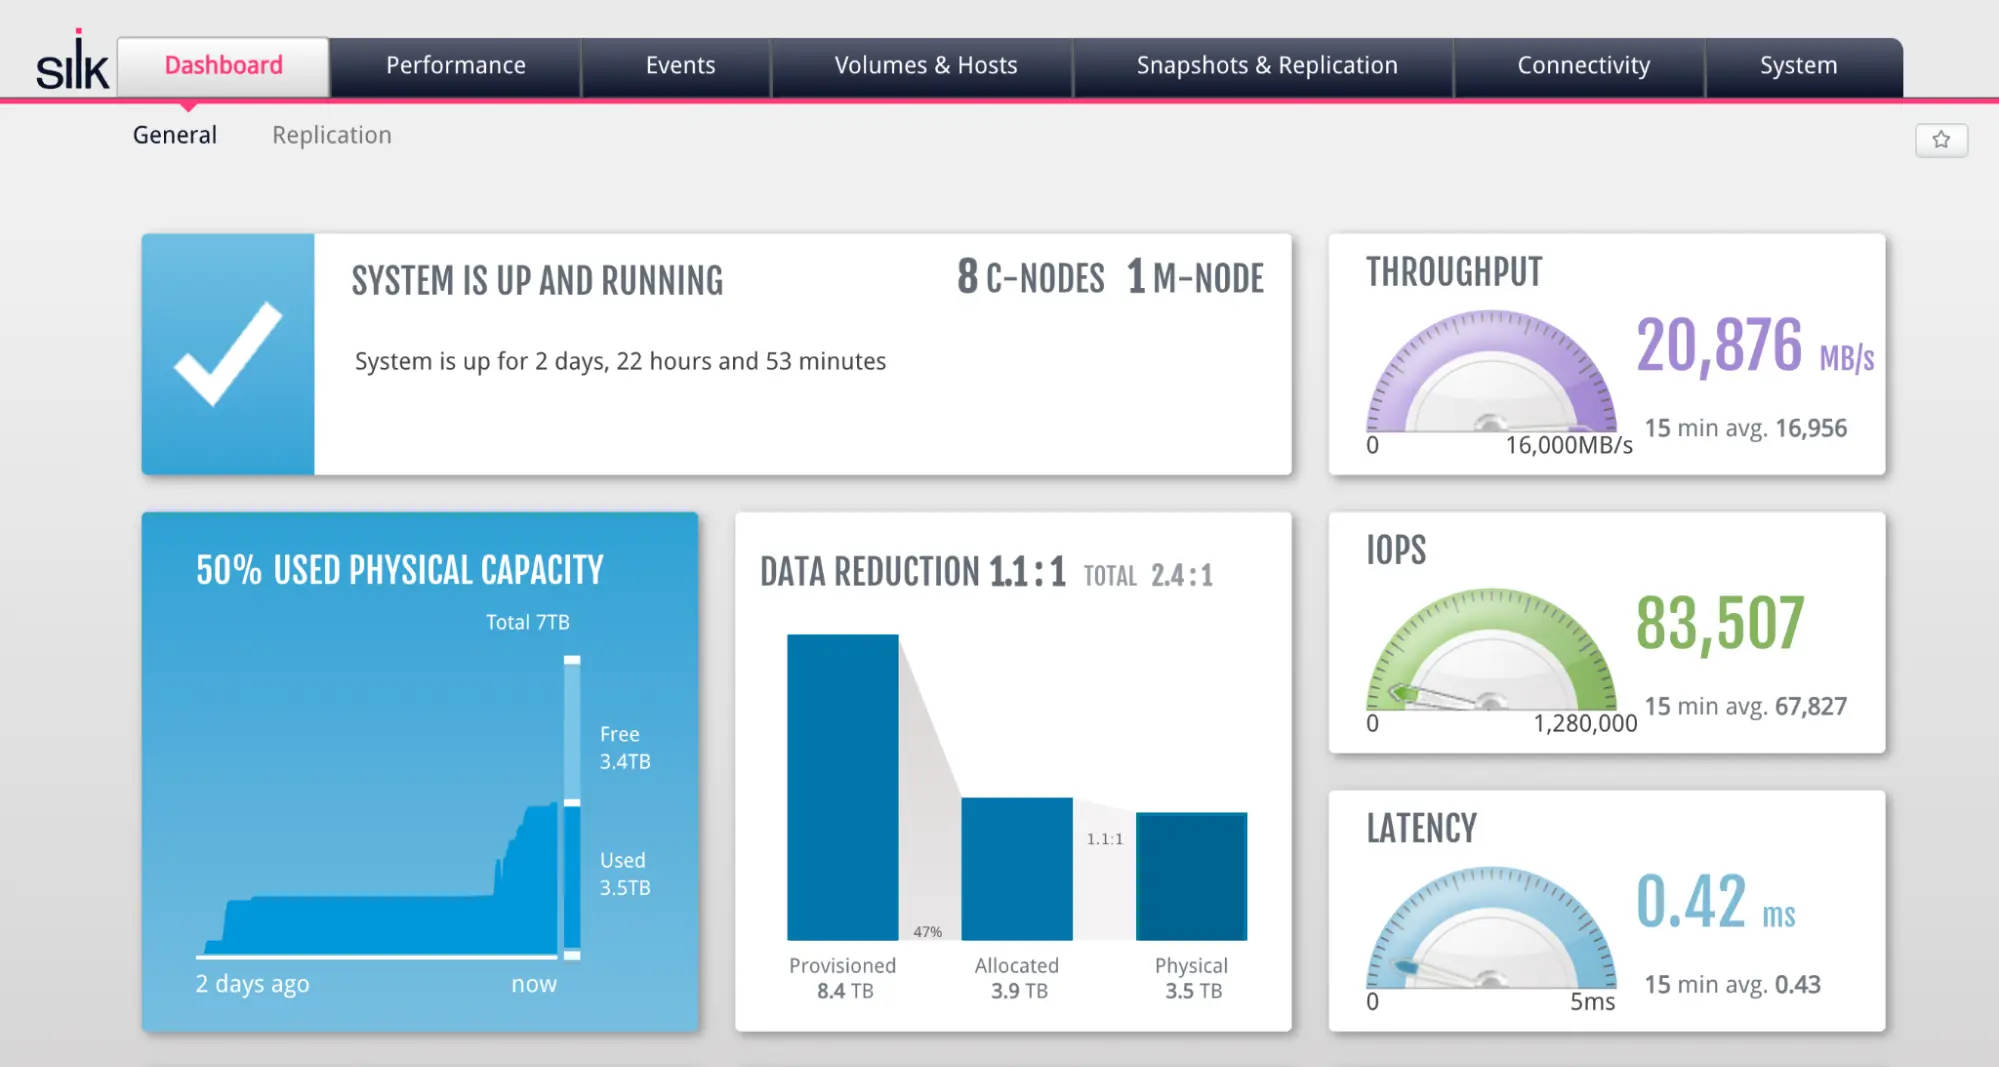
Without further ado, this is a screenshot from one of my tests, where a single Linux VM was doing large read I/Os against the Silk datastore, all hosted in the Google Cloud Platform. I will dive into details later in the article.
Disclosure: This testing and writing was a paid consulting engagement. Before taking it, I read through the latest Silk Platform Architecture documents to make sure that this technology would be capable of delivering its promise and I could find interesting results to write about. Both the architectural approach and my previous experiments indeed passed the test!
Revisiting the Silk Data Platform: Scalable Architecture by Design
What is the Silk Data Platform? It is a software-defined, scalable cloud storage platform that works in all major clouds and achieves higher performance than even the cloud vendors’ built-in elastic block stores do! Silk can deliver this as they have a different, unique approach for storing and serving your data in the cloud.
With Silk, your cloud VMs, client hosts, access data via regular OS block devices - but under the hood the client OS uses standard iSCSI over TCP protocol to send the I/O requests to the Silk Data Platform that lives in the same cloud as your applications. In the backend, the data is physically persisted on NVMe SSD disk devices that are locally attached to the Silk cluster nodes that you access over iSCSI. This gives the Silk Platform not only the needed I/O latency and concurrency, but also much more flexibility and control over doing I/O in the cloud. This means higher I/O throughput and lower latency than the built-in cloud “elastic block storage” systems provide!
When talking about I/O throughput, the other factor in Silk’s performance is that it uses the regular Cloud VM networking for serving all the I/Os. The VM-to-VM network throughput has risen up to 200 Gbit/s by now, depending on your VM type and size. This allows you to achieve such performance even just in a single client VM. Of course when you need scalability and failure tolerance, it is not as simple as just serving a bunch of remote SSDs from a single VM to another, this is where Silk’s innovation comes in.
Here’s an architecture diagram of the Silk Data Platform that I created. I’m using my own terminology and wording here, to keep everything simple at high level:
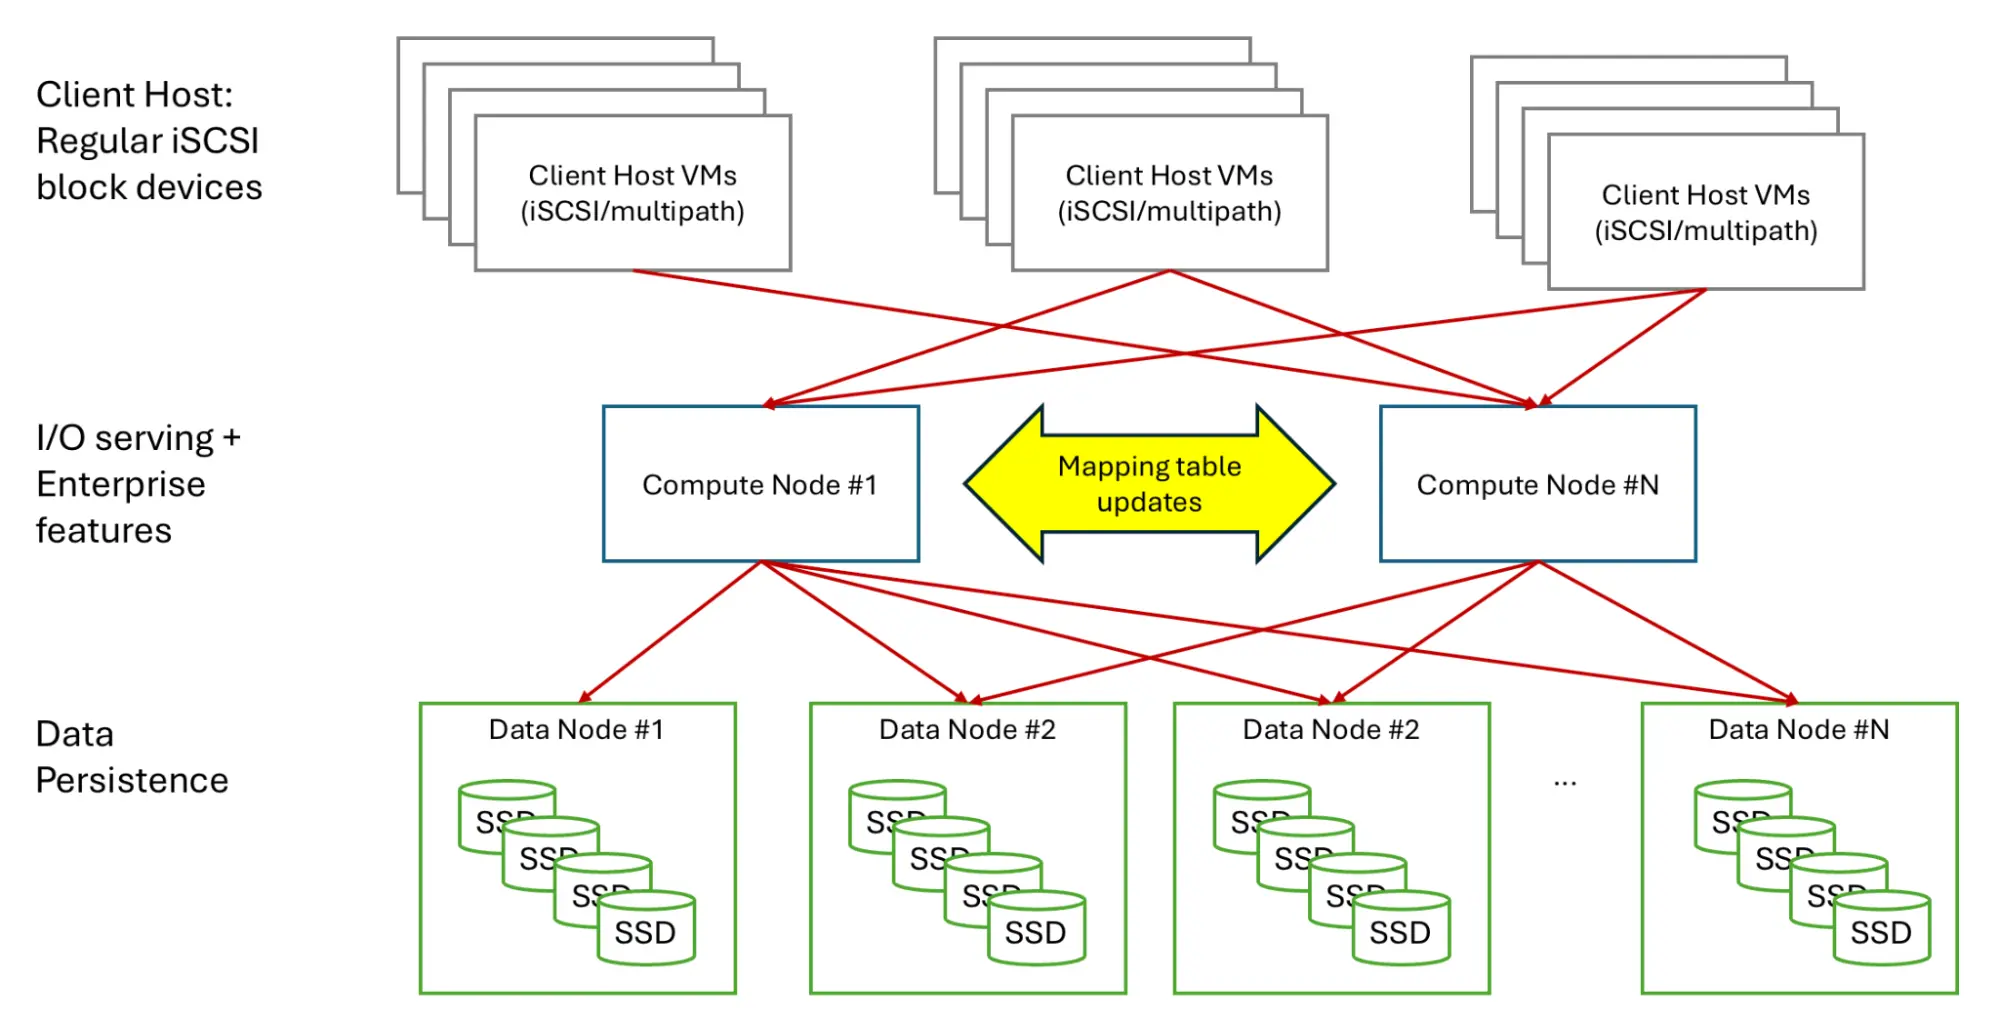
If you look into the left side of the diagram above, we have 3 layers in the I/O story. The top layer is the many cloud instances/VMs where your applications and databases live, but most of the interesting I/O action happens in the Silk layers below:
-
The client hosts communicate with Silk via a remote block device protocol over TCP, in this case iSCSI. Therefore, no agents or Silk software needs to be installed on your VMs, as the client layer is already built into your OS kernel. The Silk volumes show up as regular block devices that you can create filesystems on.
-
Most of the magic happens in the Silk software in the middle layer. The compute layer (c.nodes) are the ones that serve client hosts their I/O and oversee all data, stored in the data persistence layer below. The compute layer keeps track of where relevant data is stored, using sophisticated distributed mapping tables that are resilient to any cloud VM node failures. All the enterprise features that I’ll talk about next are implemented there, in Silk software.
-
The data persistence layer is where the data is physically stored, on locally attached NVMe SSDs inside the d.nodes, that provide great I/O latency and concurrency. The compute layer talks to the Silk software in the data layer and presents the read I/O results back to the client hosts. For best write latency, the Silk compute nodes actually buffer the written data in the compute layer memory (and replicate it to other c.nodes for resilience) and destage the compressed written blocks to data layer later on. This approach is similar to what your traditional on-premises storage solutions do with their RAM-based write-back caches.
The Silk Data Platform data persistence layer is implemented as a shared-nothing group of data nodes, but the compute layer is a proper distributed system that is both scalable (with more compute nodes added) and fault-tolerant, thanks to the distributed mapping table implemented in the compute nodes.
Having two separate layers where each compute node can talk to any data node means that you can scale each layer up and down independently! Need more disk space? Scale up data nodes. Need more IOPS and throughput? Scale up compute nodes.
I wanted to start with using my own understanding to describe the Silk platform, now let’s dig deeper.
Silk Platform Complete Architecture
Here’s a more complete picture of what the Silk platform architecture looks like, using the Silk terminology:
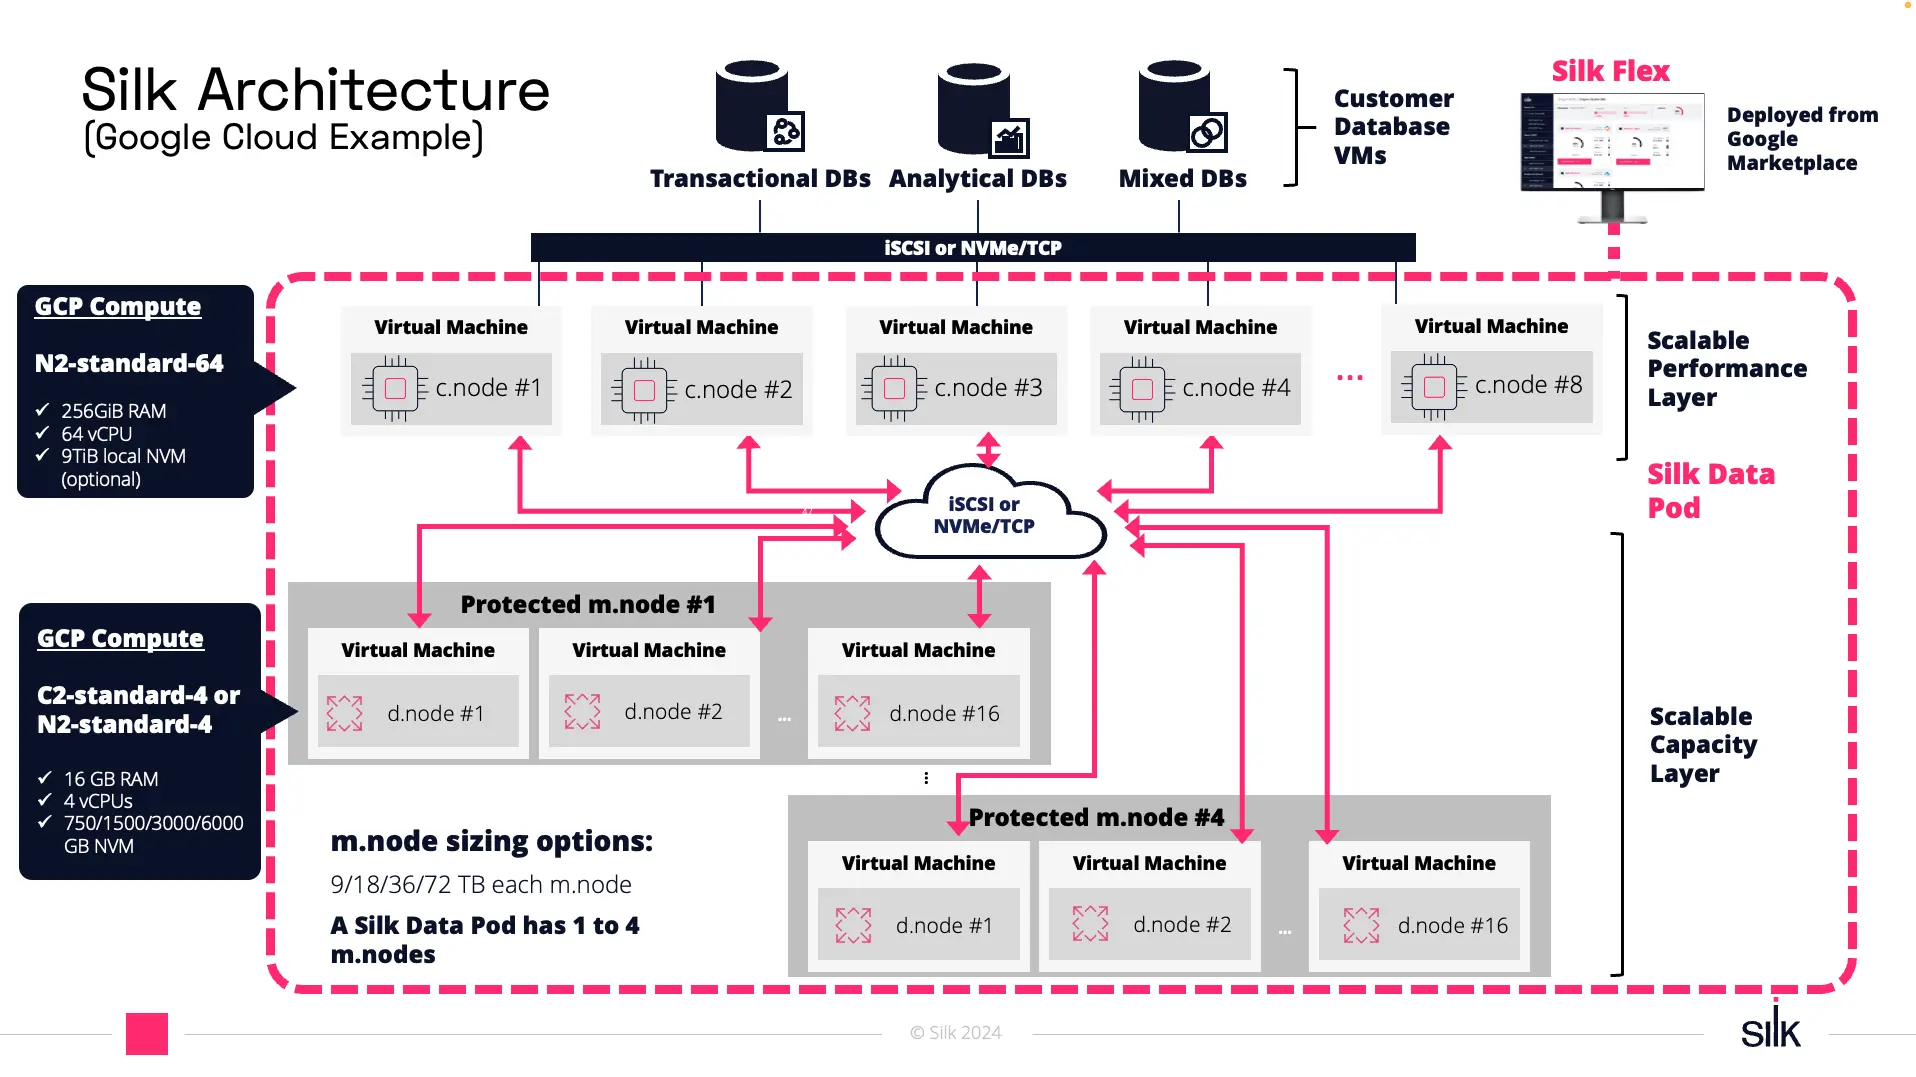
Here’s the Silk terminology for what I explained above using my own wording and understanding:
- Performance Layer is what I called the compute layer that does all the enterprise magic (c.nodes)
- Capacity Layer is what I called the data persistence layer that actually stores the data on local NVMe SSDs (d.nodes)
The media nodes (m.nodes) are not a separate physical layer, but rather a manageability concept. They’re a logical grouping of physical data nodes, which each have a bunch of NVMe SSDs in them, combined into one striped, RAID based erasure coding-protected physical storage pool in the Silk cluster. For example, this allows you to compose one media node from older and cheaper instance types to support your enterprise-wide filesystem activity and another media node consisting of latest cloud instances, with fastest NVMe disks, for your performance sensitive database activity. Silk’s approach gives you control and flexibility even in the cloud.
Enterprise Features
As I said in my previous article, yes it is possible to shove a bunch of locally attached NVMe SSDs into a single server and get really good I/O throughput out of it locally. But none of that matters for enterprise data usage scenarios if you can not do it reliably, securely and with all the other enterprise requirements in mind.
Individual SSDs and servers will fail and you would lose your data if you didn’t have resilience built into your storage platform. Entire data centers, cloud regions can also go offline, so you need to make sure that your data is replicated into another location for business continuity. And then you’d also need things like compression, deduplication, snapshots, thin cloning, etc - all managed via an API or UI.
Back in the old days, you would buy big iron SAN storage arrays to get these required enterprise features, implemented in the storage array “hardware”. In the cloud, it makes sense to also look at your cloud vendor’s default block storage solutions - unless you need more performance and flexibility - and multi-cloud. This is where Silk’s software-defined platform comes in.
Here are some enterprise features of interest:
- Thanks to its architecture, Silk can deliver higher I/O performance than even the built-in cloud block storage devices offered by the cloud vendors! (This is exactly what got my attention)
- Silk compute nodes compress all data using the Silk compute node CPUs, so your database server CPUs won’t have to deal with that, and fewer bytes will be moved between the compute nodes and data nodes, not to mention the lowered storage space usage.
- When talking about databases, we are not only talking about table data here, but any data, like any file blocks in a filesystem and all database files (indexes, temp, undo, etc).
- Silk performs block level data deduplication and zero elimination in the compute nodes too and that is done before the data lands on the disk.
- Snapshot and thin clone creation is just a metadata operation at the compute node metadata level, done without duplicating data.
- Silk doesn’t mirror your data across d.nodes (50% of total raw disk space is overhead), but uses a more sophisticated algorithm with only 12.5% disk space overhead. This is achieved by erasure coding with striping data blocks across many disks in 16 data nodes that can tolerate even simultaneous failures of two data nodes. More details are available in their latest architecture guide.
- Silk can replicate data across cloud availability zones, global regions and even between different clouds! This is a big deal if you are running a multi-cloud environment. You can open snapshots of your replicated databases and file systems on Silk running on a different cloud, while the replication for data resilience is still ongoing.
Testing
If you want to go straight to my summary about what does Silk give you (instead of all the technical details), then jump to summary.
Since achieving over 20 GiB/s read I/O rate in a single cloud VM got the “performance nerd” in me excited, I started with that. Not every cloud VM shape can do that, this depends on the VM-to-VM network capabilities (and allowance) of the VMs. The Silk backend scales out to multiple nodes, so it’s not limited by a single VM’s network throughput cap. But if you have a single client host VM that needs high I/O bandwidth just for itself, you need to choose the right instance size accordingly.
I started with a c4-standard-8 GCP instance that also offers pretty solid network bandwidth of 23 Gbit/s (networks have gotten fast!), but for the maximum performance test, I used the c4-standard-192 instance that also had the GCP’s “high-bandwidth networking” feature enabled to get all the way to 200 Gbit speeds.
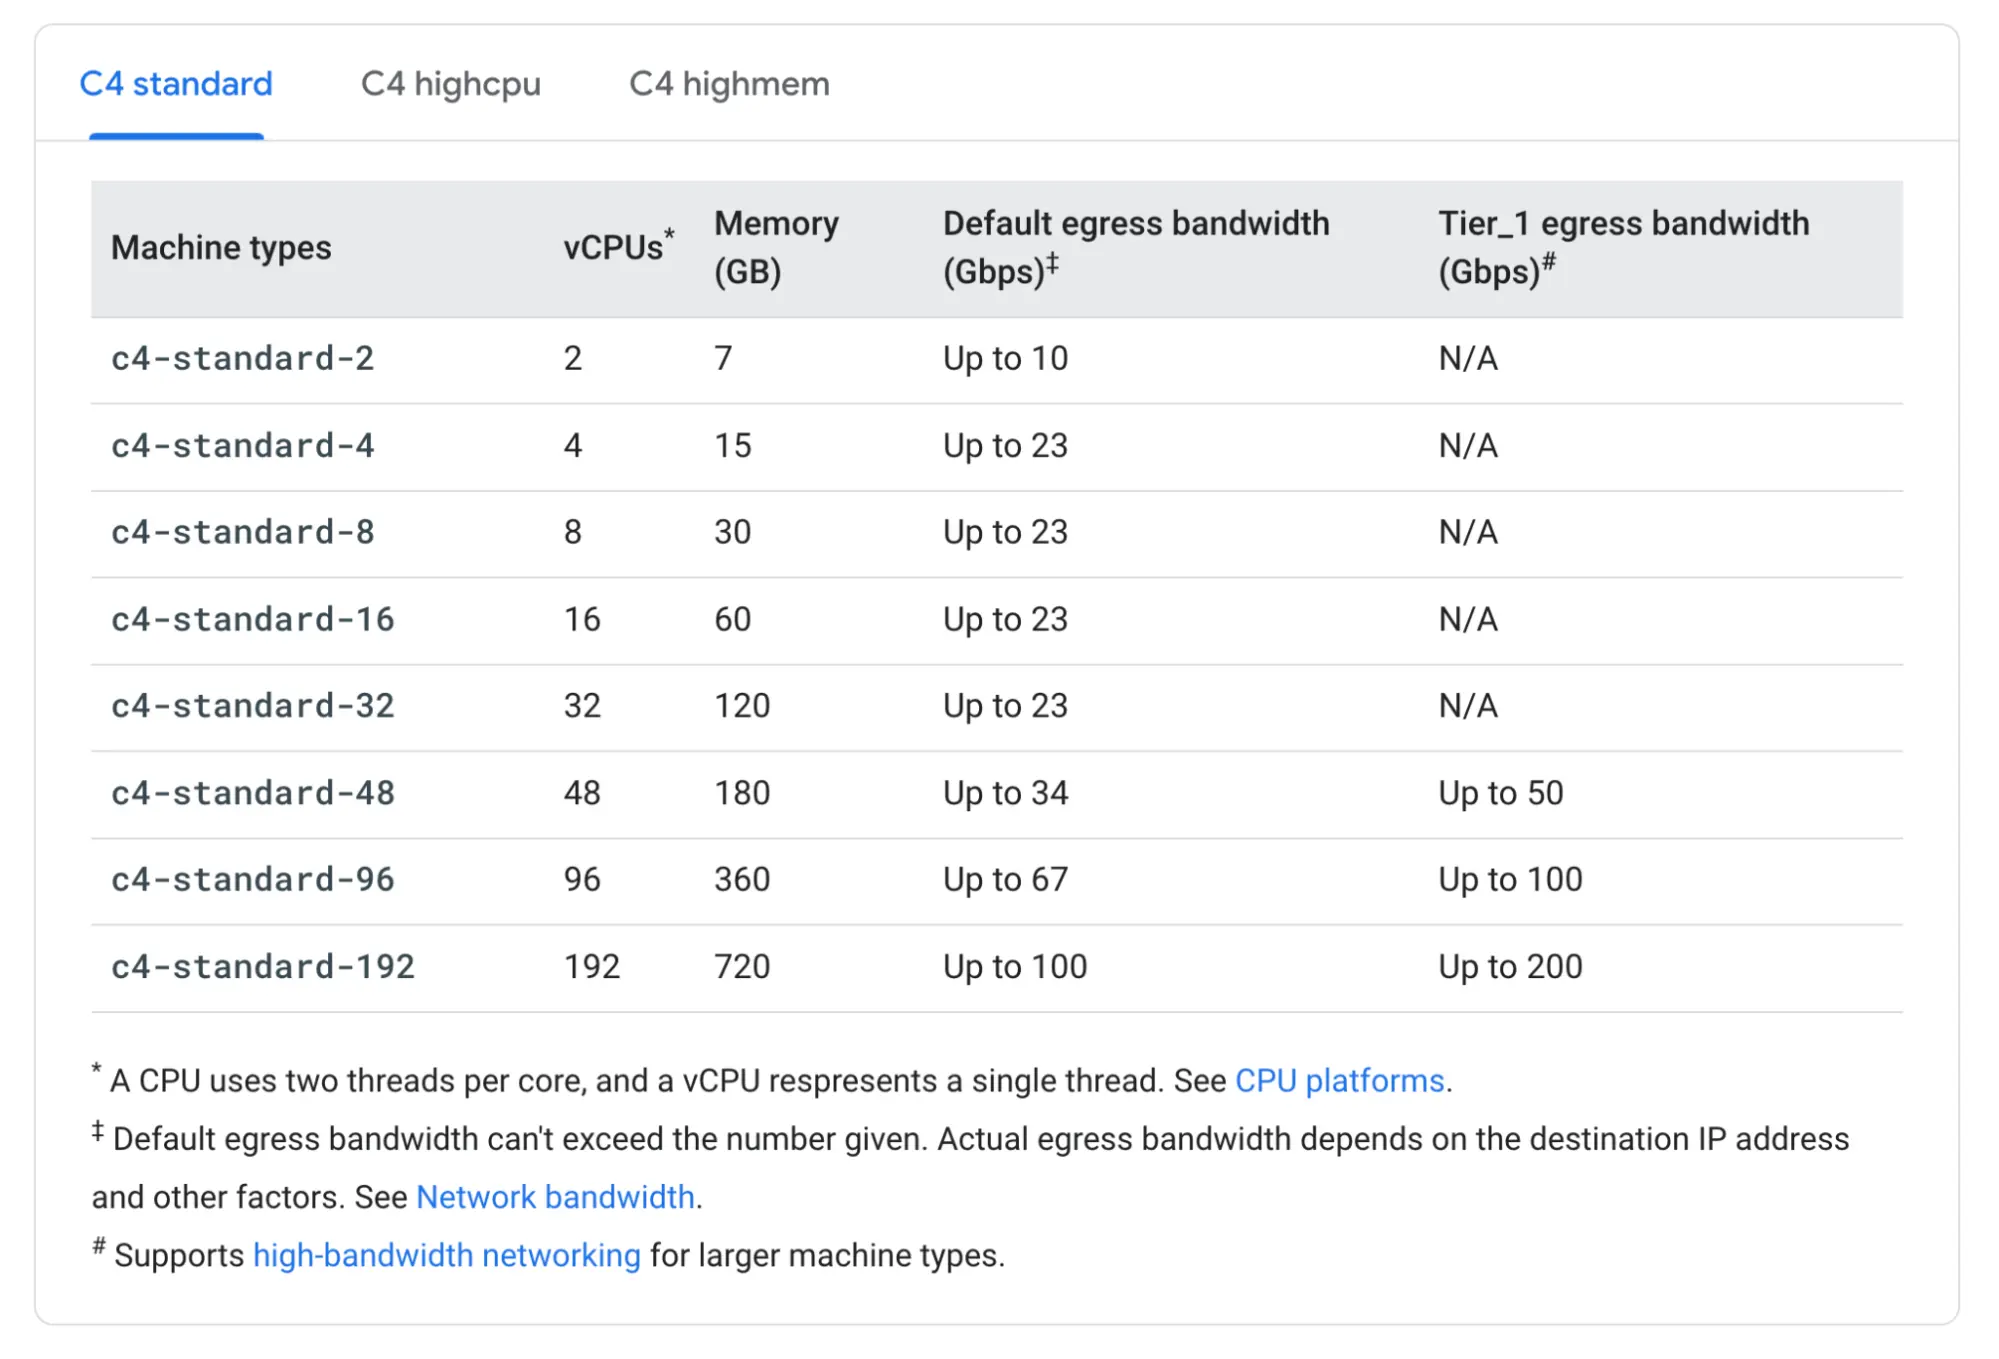
Here’s one interesting insight. The cloud providers apparently mostly worry about and constrain network egress bandwidth of each VM - in other words, download from the VM. But if a cloud client host VM is doing read I/Os from the Silk Platform (cluster of multiple nodes, each with their own network capacity), the data flows as ingress (upload) into that client VM. That is one of the reasons why even the c4-standard-8 VM, advertised with max 23 Gbps network egress bandwidth, could often deliver much higher read throughput (ingress) in my tests, up to 5 gigabytes/s, even with the smallest Silk configuration. The writes would be more likely constrained to the advertised network throughput.
As I mentioned previously, nothing has to be installed on the host cloud VMs. At Linux level, the Silk devices showed up as standard iSCSI block devices (/dev/sd*) and Silk provides a multipathing configuration file that pulls all these devices into your data volumes (/dev/mapper/mpath*). You can create your file systems directly on these data volumes as usual or create smaller logical volumes out of the bigger devices first.
I used Ubuntu Linux 24.04 with the latest Linux 6.8.0 kernel update that Ubuntu offers for GCP. I used Linux logical volumes to make my testing easier, as I created and recreated filesystems with various different options, but with Silk you don’t really need to use them as you can just provision the exact number and sizes of physical volumes that you need. They’re all thinly provisioned and will show up as additional multipath block devices in Linux.
To measure the raw block I/O performance with minimal interference by the OS and any database engines, I used the fio tool for I/O performance testing - specifically using the direct I/O option (O_DIRECT in Linux). That way, on Linux, the pagecache won’t be used for I/O, so you get the real I/O numbers and also the OS pagecache won’t end up a bottleneck itself, when running lots of I/Os at high concurrency.
The contents of my onessd.sh fio script are listed below. I’m using direct I/O and random asynchronous reads with queue depth of 32. I would provide the number of fio concurrent processes, the block device name and I/O block size on the command line:
#!/bin/bash

[ $# -ne 3 ] && echo Usage $0 numjobs /dev/DEVICENAME BLOCKSIZE && exit 1

fio --readonly --name=onessd \
    --filename=$2 \
    --filesize=100% --rw=randread --bs=$3 --direct=1 --overwrite=0 \
    --numjobs=$1 --iodepth=32 --time_based=1 --runtime=3600 \
    --ioengine=libaio \
    --group_reporting
First, I ran a single fio process, doing 1MB sized random reads with queue depth 32, but it wasn’t enough to push the I/O throughput to the max, as the fio process itself might have become a processing bottleneck at high I/O rates, that’s why you’d want to run multiple workers. So I ran two workers, each with their own queue depth of 32 (number of ongoing async I/Os) and indeed got to over 20 gigabytes per second of read I/O throughput. Not bad for a cloud VM!

Just to make sure that this rate would be sustained over time, I sometimes kept the benchmark running for an hour and didn’t see any major throughput “blips” when going through the Linux dstat output and the Silk performance dashboard. I did see occasional short (1-second) throughput drops from 20 GiB/s to 18 GiB/s, but this was not surprising as when pushing the cloud VM’s network capabilities to the max, some variability is expected, both in the cloud and your corporate SAN networks too. As the Silk backend consists of multiple VMs, it can handle even more traffic in aggregate.
In the two examples below, I was running the same test with 256kB I/O sizes and still got to the maximum throughput:

Here’s the Silk Performance history view, showing the sustained read I/O rate in one of my tests:
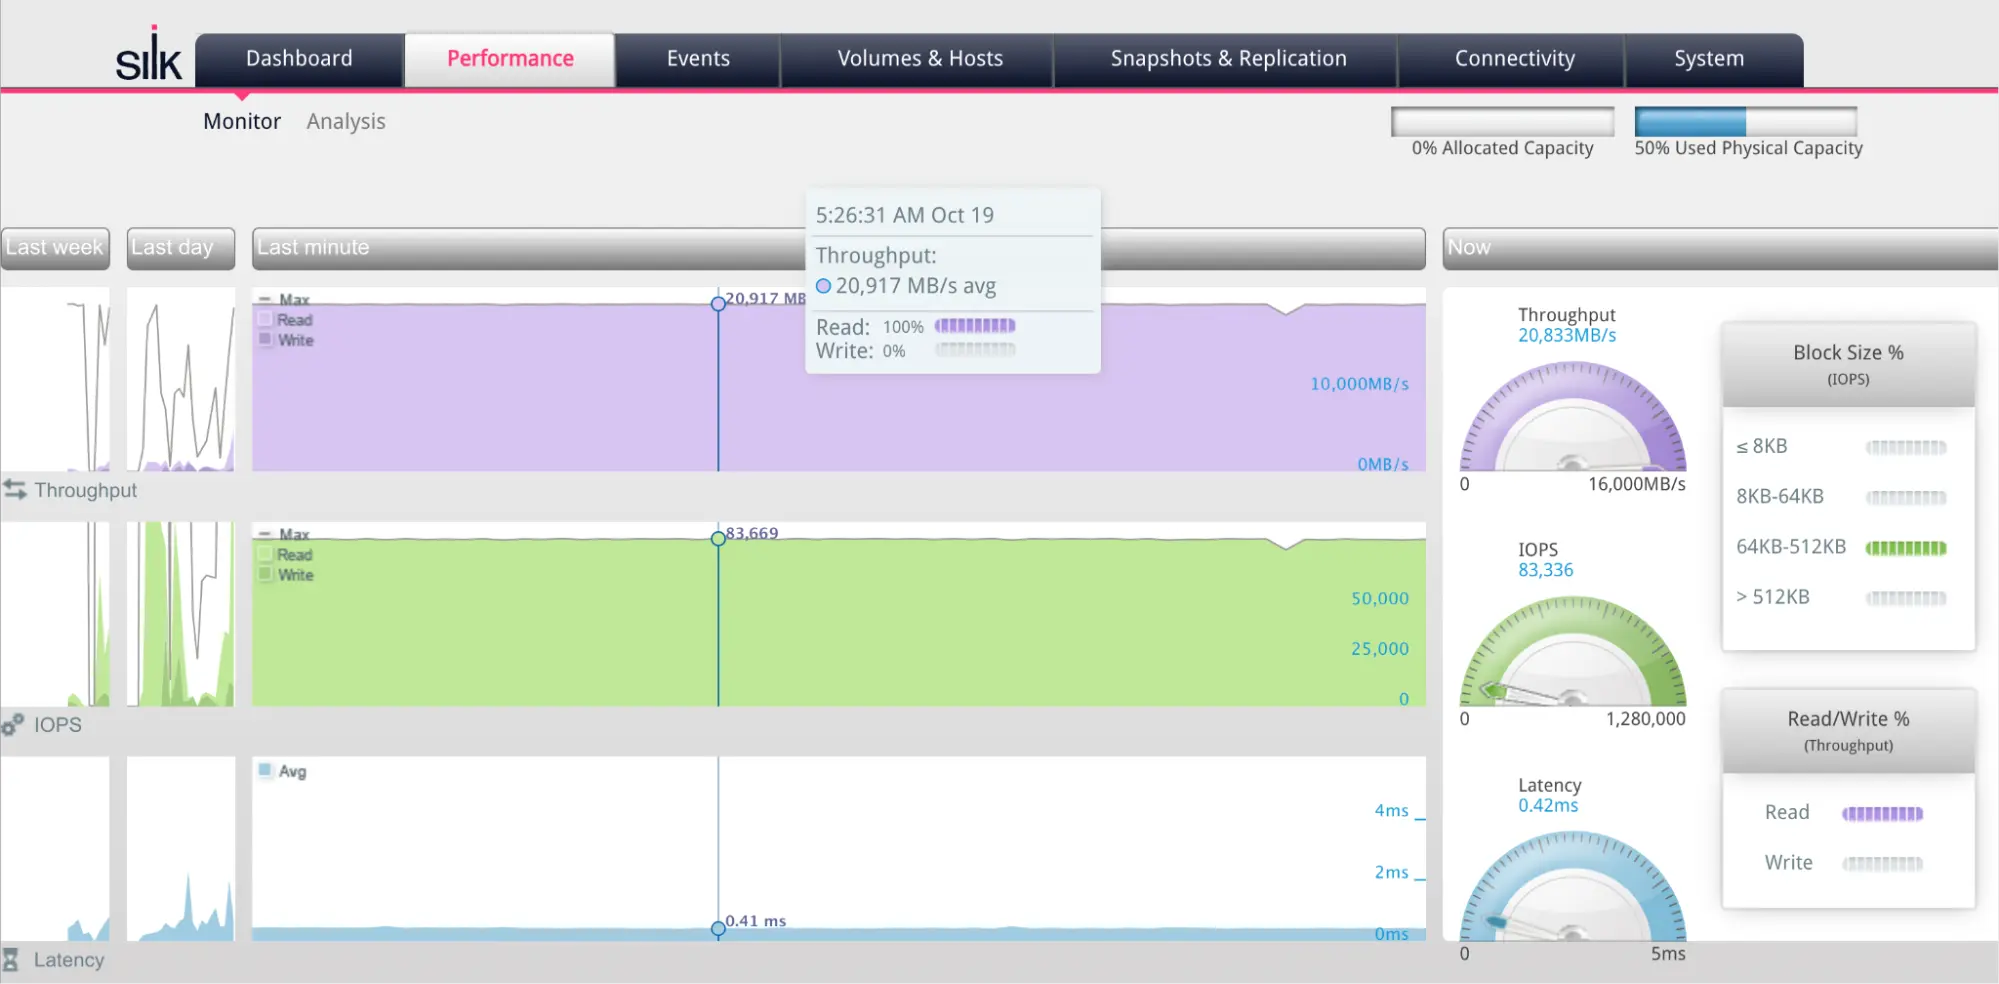
This kind of I/O bandwidth is something that your data warehouses, analytics systems and anything that needs to process a lot of data will like.
IO latency
So far I have talked about the “large read” use case. What about small random reads that your OLTP databases will use? Also, I/O latency and writes?
I plan to write about writes and mixed I/O in Postgres 17 database performance test context in the next blog entry, so I’ll first present some OS-level results from fio here. Since I/O latency is important for many (database) workloads, I started from a smaller scale test, doing “only” 100k I/Os per second, with random 8kB sized reads.
100k IOPS (8 kB random reads)
First, I ran fio with one worker, queue depth 32, doing 8kB random read I/Os. This gave us over 100k IOPS, with half of the I/Os taking up to 221 microseconds to complete and 99% of the I/Os taking no more than around 1 millisecond to complete.
$ sudo ./onessd.sh 1 /dev/mapper/mpathai 8k
onessd: (g=0): rw=randread, bs=(R) 8192B-8192B, (W) 8192B-8192B, (T) 8192B-8192B,
        ioengine=libaio, iodepth=32
fio-3.36
Starting 1 process
^Cbs: 1 (f=1): [r(1)][2.1%][r=781MiB/s][r=99.9k IOPS][eta 58m:44s]
fio: terminating on signal 2

onessd: (groupid=0, jobs=1): err= 0: pid=1317635: Thu Oct 17 01:55:34 2024
  read: IOPS=101k, BW=790MiB/s (829MB/s)(58.6GiB/75875msec)
    slat (nsec): min=1790, max=731247, avg=5790.68, stdev=3289.89
    clat (usec): min=83, max=17441, avg=310.00, stdev=223.25
     lat (usec): min=97, max=17446, avg=315.79, stdev=223.26
    clat percentiles (usec):
     |  1.00th=[  130],  5.00th=[  149], 10.00th=[  180], 20.00th=[  196],
     | 30.00th=[  204], 40.00th=[  212], 50.00th=[  221], 60.00th=[  231],
     | 70.00th=[  249], 80.00th=[  469], 90.00th=[  594], 95.00th=[  799],
     | 99.00th=[ 1020], 99.50th=[ 1188], 99.90th=[ 1909], 99.95th=[ 2802],
     | 99.99th=[ 3687]
   bw (  KiB/s): min=382800, max=905968, per=100.00%, avg=809486.94
The fio output already showed good I/O latencies at 100k IOPS, but it measures latency at the application level. This may inflate the latency numbers due to things like system call overhead, CPU scheduling latency and any application delays with its I/O completion checking logic. For completeness, I used the eBPF biolatency tool to measure latencies at the Linux block device level too:
# biolatency-bpfcc

Tracing block device I/O... Hit Ctrl-C to end.
^C
     usecs               : count     distribution
         0 -> 1          : 0        |                                        |
         2 -> 3          : 0        |                                        |
         4 -> 7          : 0        |                                        |
         8 -> 15         : 0        |                                        |
        16 -> 31         : 0        |                                        |
        32 -> 63         : 0        |                                        |
        64 -> 127        : 2902     |                                        |
       128 -> 255        : 132536   |****************************************|
       256 -> 511        : 20499    |******                                  |
       512 -> 1023       : 24953    |*******                                 |
      1024 -> 2047       : 849      |                                        |
      2048 -> 4095       : 34       |                                        |
The block device level latency distribution looks similar enough to what fio reported. So let’s scale up the IOPS and see what happens!
300k IOPS (8 kB random reads)
Now we are doing over 300k IOPS. I had to start 4 fio worker processes, so that it could use 4 CPUs to handle all its IO submission and completion processing without becoming a bottleneck. Therefore the maximum in-flight I/Os that fio submits to this multipath block device is 4 x 32 = 128. This multipath block device actually consists of 24 underlying iSCSI block devices and they each have their own I/O queues in the Linux kernel. With this configuration, it results in 24 x 32 = 768 I/Os in-flight possible, issued from this VM, just against this Silk volume (but you can provision more).
$ sudo ./onessd.sh 4 /dev/mapper/mpathai 8k
onessd: (g=0): rw=randread, bs=(R) 8192B-8192B, (W) 8192B-8192B, (T) 8192B-8192B,
        ioengine=libaio, iodepth=32
...
fio-3.36
Starting 4 processes
^Cbs: 4 (f=4): [r(4)][0.8%][r=2532MiB/s][r=324k IOPS][eta 59m:30s]
fio: terminating on signal 2

onessd: (groupid=0, jobs=4): err= 0: pid=1327522: Thu Oct 17 02:03:22 2024
  read: IOPS=314k, BW=2450MiB/s (2569MB/s)(72.6GiB/30334msec)
    slat (nsec): min=1570, max=2391.8k, avg=11223.12, stdev=5640.57
    clat (usec): min=102, max=31584, avg=396.43, stdev=228.60
     lat (usec): min=111, max=31594, avg=407.66, stdev=229.25
    clat percentiles (usec):
     |  1.00th=[  172],  5.00th=[  212], 10.00th=[  233], 20.00th=[  258],
     | 30.00th=[  281], 40.00th=[  297], 50.00th=[  322], 60.00th=[  347],
     | 70.00th=[  408], 80.00th=[  553], 90.00th=[  652], 95.00th=[  750],
     | 99.00th=[ 1106], 99.50th=[ 1434], 99.90th=[ 2540], 99.95th=[ 2933],
     | 99.99th=[ 4047]
   bw (  MiB/s): min= 1419, max= 2818, per=100.00%, avg=2449.79, stdev=73.73,
The Silk backend scales well with this amount of I/Os going on. While half of the I/Os now take up to 322 microseconds, the 99th percentile shows that the vast majority of I/Os complete in under 1.1 milliseconds.
# biolatency-bpfcc

Tracing block device I/O... Hit Ctrl-C to end.
^C
     usecs               : count     distribution
         0 -> 1          : 0        |                                        |
         2 -> 3          : 0        |                                        |
         4 -> 7          : 0        |                                        |
         8 -> 15         : 0        |                                        |
        16 -> 31         : 0        |                                        |
        32 -> 63         : 0        |                                        |
        64 -> 127        : 576      |                                        |
       128 -> 255        : 95948    |****************************************|
       256 -> 511        : 30825    |************                            |
       512 -> 1023       : 24875    |**********                              |
      1024 -> 2047       : 1953     |                                        |
      2048 -> 4095       : 108      |                                        |
      4096 -> 8191       : 4        |                                        |
      8192 -> 16383      : 2        |                                        |
The biolatency tool shows that the majority of block device I/O completions still take between 128-255 microseconds to complete, unlike what fio reported above. I didn’t get to drill down into this discrepancy, but one explanation is that the fio processes just didn’t manage to (asynchronously) check and register the I/O completions fast enough as they were so busy with their work on the CPUs. Or perhaps there’s an extra Linux kernel multipath latency involved at higher levels in the I/O stack (where fio measures its things).
Biolatency is also showing that there are rare I/Os that take 4+ or 8+ milliseconds, instead of a few hundred microseconds. This is not surprising when you start pushing your network and storage system with many concurrent I/Os. Generally, some of the I/O completion latency may also come from queuing at the OS block device level, although Silk’s usage of Linux multipathing does spread out the I/Os across multiple different underlying block devices and different Silk compute nodes.
In my previous blog post (written in 2021) I mentioned that Silk buffers write I/Os for lower write latency in its compute layer RAM, of course first duplicated into multiple compute nodes for resiliency. Silk itself does not cache reads in RAM as the best place where to cache your data is in your database or application memory, closest to all the processing action on the CPUs.
Since I wrote my previous blog post, Silk has introduced a new option that can use locally attached NVMe SSDs as a read cache in the compute nodes too, to avoid a network hop to the data layer and reduce read latency further. I didn’t get to testing that new feature, but with these results I don’t think I needed it.
What about the maximum small I/O performance?
When you’re running an OLTP database or anything else doing lots of random I/Os (via indexes), you’d also be interested in the maximum IOPS of the system. So, let’s see how far can we push Silk in this VM with random 8kB block reads.
For the maximum performance test (of a currently available single Silk configuration) I used 8 silk compute nodes (c.nodes), backed by 16 data nodes. The locally attached NVMe SSDs give pretty good performance and I/O concurrency (locally!), so you don’t really need to scale out the Silk data nodes, if your data fits into the existing ones. That’s the beauty and flexibility of scaling the I/O serving compute and data persistence layers independently.
I ran the same fio tool with 12 workers, so the total queue depth was 12 x 32 = 384, spread across multiple underlying iSCSI devices via multipathing, and we got pretty nice results (1.3 million IOPS), with still solid latency:
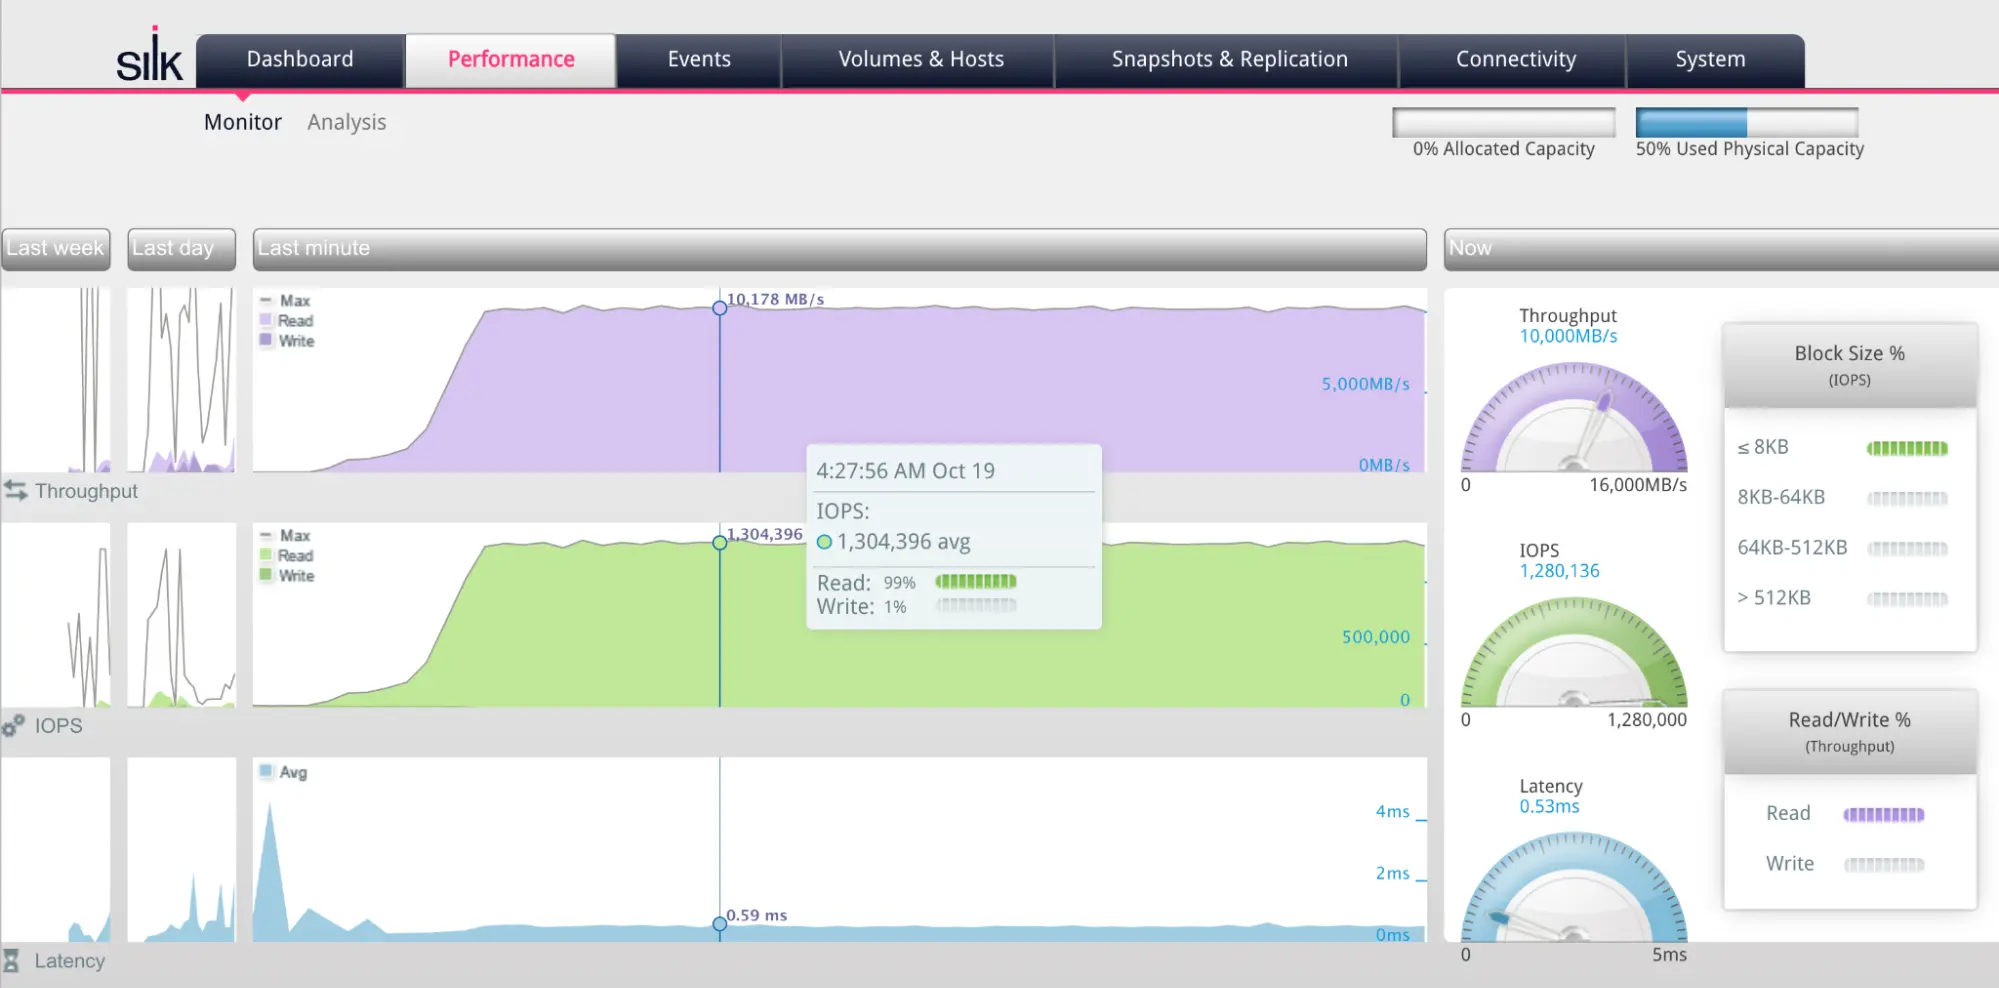
Running at over 1M IOPS is also about I/O and network bandwidth! If you look into the I/O numbers (dsk/total) below, 1.3M x 8kB IOs per second means that your infrastructure needs to be able to handle 10 GiB/s network traffic as well!

At this rate of IOPS and TCP throughput, I expected that I would have to start fine-tuning the network stack (like using jumbo frames, interrupt coalescing, TCP large receive/send offloading, etc). After all, I started with a completely default Linux configuration in GCP, with 1500 byte MTU for network devices and no customization. Somewhat surprisingly, no tuning or configuration changes were needed - I guess Linux has gotten really good at TCP performance. You might still want to fine-tune these things in high-performance networking systems to reduce the CPU usage of your traffic processing at the OS level. But as I was just focused on maximum I/O throughput here, the results were good enough. By the way, Google Cloud supports ~9kB jumbo frames between VMs, so a single frame would nicely fit an entire database block even with some protocol overhead.
What about write performance?
The write tests also performed well, getting to almost 10 GiB/s with OS level fio tests, but the database workloads needed a bit of Postgres and Linux tweaking and tuning so that they wouldn’t become bottlenecks when driving the I/Os. I will show examples of Silk write performance in my next blog entry, where I run Postgres 17 database workloads on the same Silk + VM configuration in GCP.
To show what’s coming, here’s an example of the sustained read + write I/O rates of a mostly OLTP benchmark that I ran, without even pushing the I/O subsystem to the max. With more complex database workloads, the throughput depends on how fast the database engine and benchmark application can drive the I/Os and whether there are any database or OS (pagecache) bottlenecks on the way. I pushed Postgres further in my later tests, so stay tuned for my next blog entry!

Any surprises, issues, lessons learned?
Silk is a mature product and I had already tested it in the past, there were no major surprises that would have changed my view of the capabilities of this platform.
One of the things that I expected, but didn’t happen, was that I didn’t have to tweak or fine-tune Linux kernel (or its network stack) to achieve the high IOPS and I/O bandwidth shown in my tests. It just worked out of the box. Modern Linux versions have features like block device multi-queuing that reduce Linux kernel-level contention when doing lots of IOPS, from many CPUs, even against a single block device.
Silk’s use of Linux multipathing further scales out the block device and I/O paths, both for network communication resiliency and scalability. Each iSCSI block device underlying the multipath devices your file systems use has its own I/O queue, so your total queue depth of concurrently ongoing I/Os can be higher than any single device presents. As the Silk backend can handle it, this is the key for scaling out to 1M+ IOPS, while maintaining low enough I/O latency.
Nevertheless, one finding to be aware of when scaling Silk is listed below:
-
In one of our scale-out tests from 2 compute nodes to 8 compute nodes, I noticed the max read I/O performance not reaching 20 GiB/s, but “only” about 16 GiB/s or so. This was because some of the additional compute nodes launched in GCP were not “close enough” to the other compute nodes in that cloud availability zone. If you launch a group of VMs together, GCP tries to place them closer to each other if possible, but adding more nodes later might hit this latency hiccup, depending on VM placement.
-
This can be solved by first verifying that the newly launched VM is close enough to others (via a simple ping command), before letting it join the Silk cluster. You want all your intense traffic in the same cloud availability zone anyway, to avoid cross-AZ networking costs. Also, the Silk support team can use their Clarity tool to identify and non-disruptively replace working, but poorly performing nodes that are already part of the cluster. This allows, for example, to transparently migrate persisted data to a new data node, should its cloud VM have suboptimal performance for any reason or its NVMe SSDs start showing signs of aging.
Summary: What does this mean
I like that Silk has been able to take a different architectural approach for building a scalable, enterprise-grade cloud storage platform that runs in all major clouds. You already saw the performance numbers that even the cloud vendors’ in-house “elastic block store” services do not match. My guess is that there are inevitable engineering trade-offs when you’re building a general purpose block store and required networking for the entire range of possible cloud customers vs. something that you can launch using regular cloud VMs at will, within your current availability zone. So, Silk additionally gives you flexibility and control over your data infrastructure, even when running in the cloud(s).
Another thing that I realized - locally attached NVMe SSD I/O throughput is great already, so it’s really the network throughput that defines how much data you can move between your VMs. Back in 2021, three years ago when the cloud VM hosts typically had 40 Gbit and 100 GBit network cards in them, my single-VM tests showed a maximum 5 gigabytes/s I/O throughput with Silk (3 compute nodes). Now even the smallest Silk configuration (2 compute nodes) can deliver this throughput, as we have 200 Gbit and 400 Gbit NICs in new servers - and this time we got to over 20 GiB/s. And networks keep getting faster! The 1.6 Terabit Ethernet standard was approved in the beginning of 2024, so I wouldn’t be surprised if it’s possible to show 80 GiB/s I/O throughput in a single cloud VM in 2027.
I can not make any promises on behalf of Silk or cloud and hardware vendors, but so far I have seen nothing in Silk’s architecture that would prevent keeping up and scaling with the latest hardware advancements. It’s a software defined, distributed platform, designed to scale in the cloud after all. And importantly, hands-on testing results back it up.
Appendix: Further reading and technical details
I explained much more about the Silk architecture in my original article and didn’t duplicate much of that in this one, so it’s worth reading my previous article too. Silk’s Architecture guide has plenty of technical details about the platform internals and I/O flow, so that would be good further reading.
- My previous Silk Platform testing article (2021)
- Silk Cloud Data Platform Architecture document (2024)
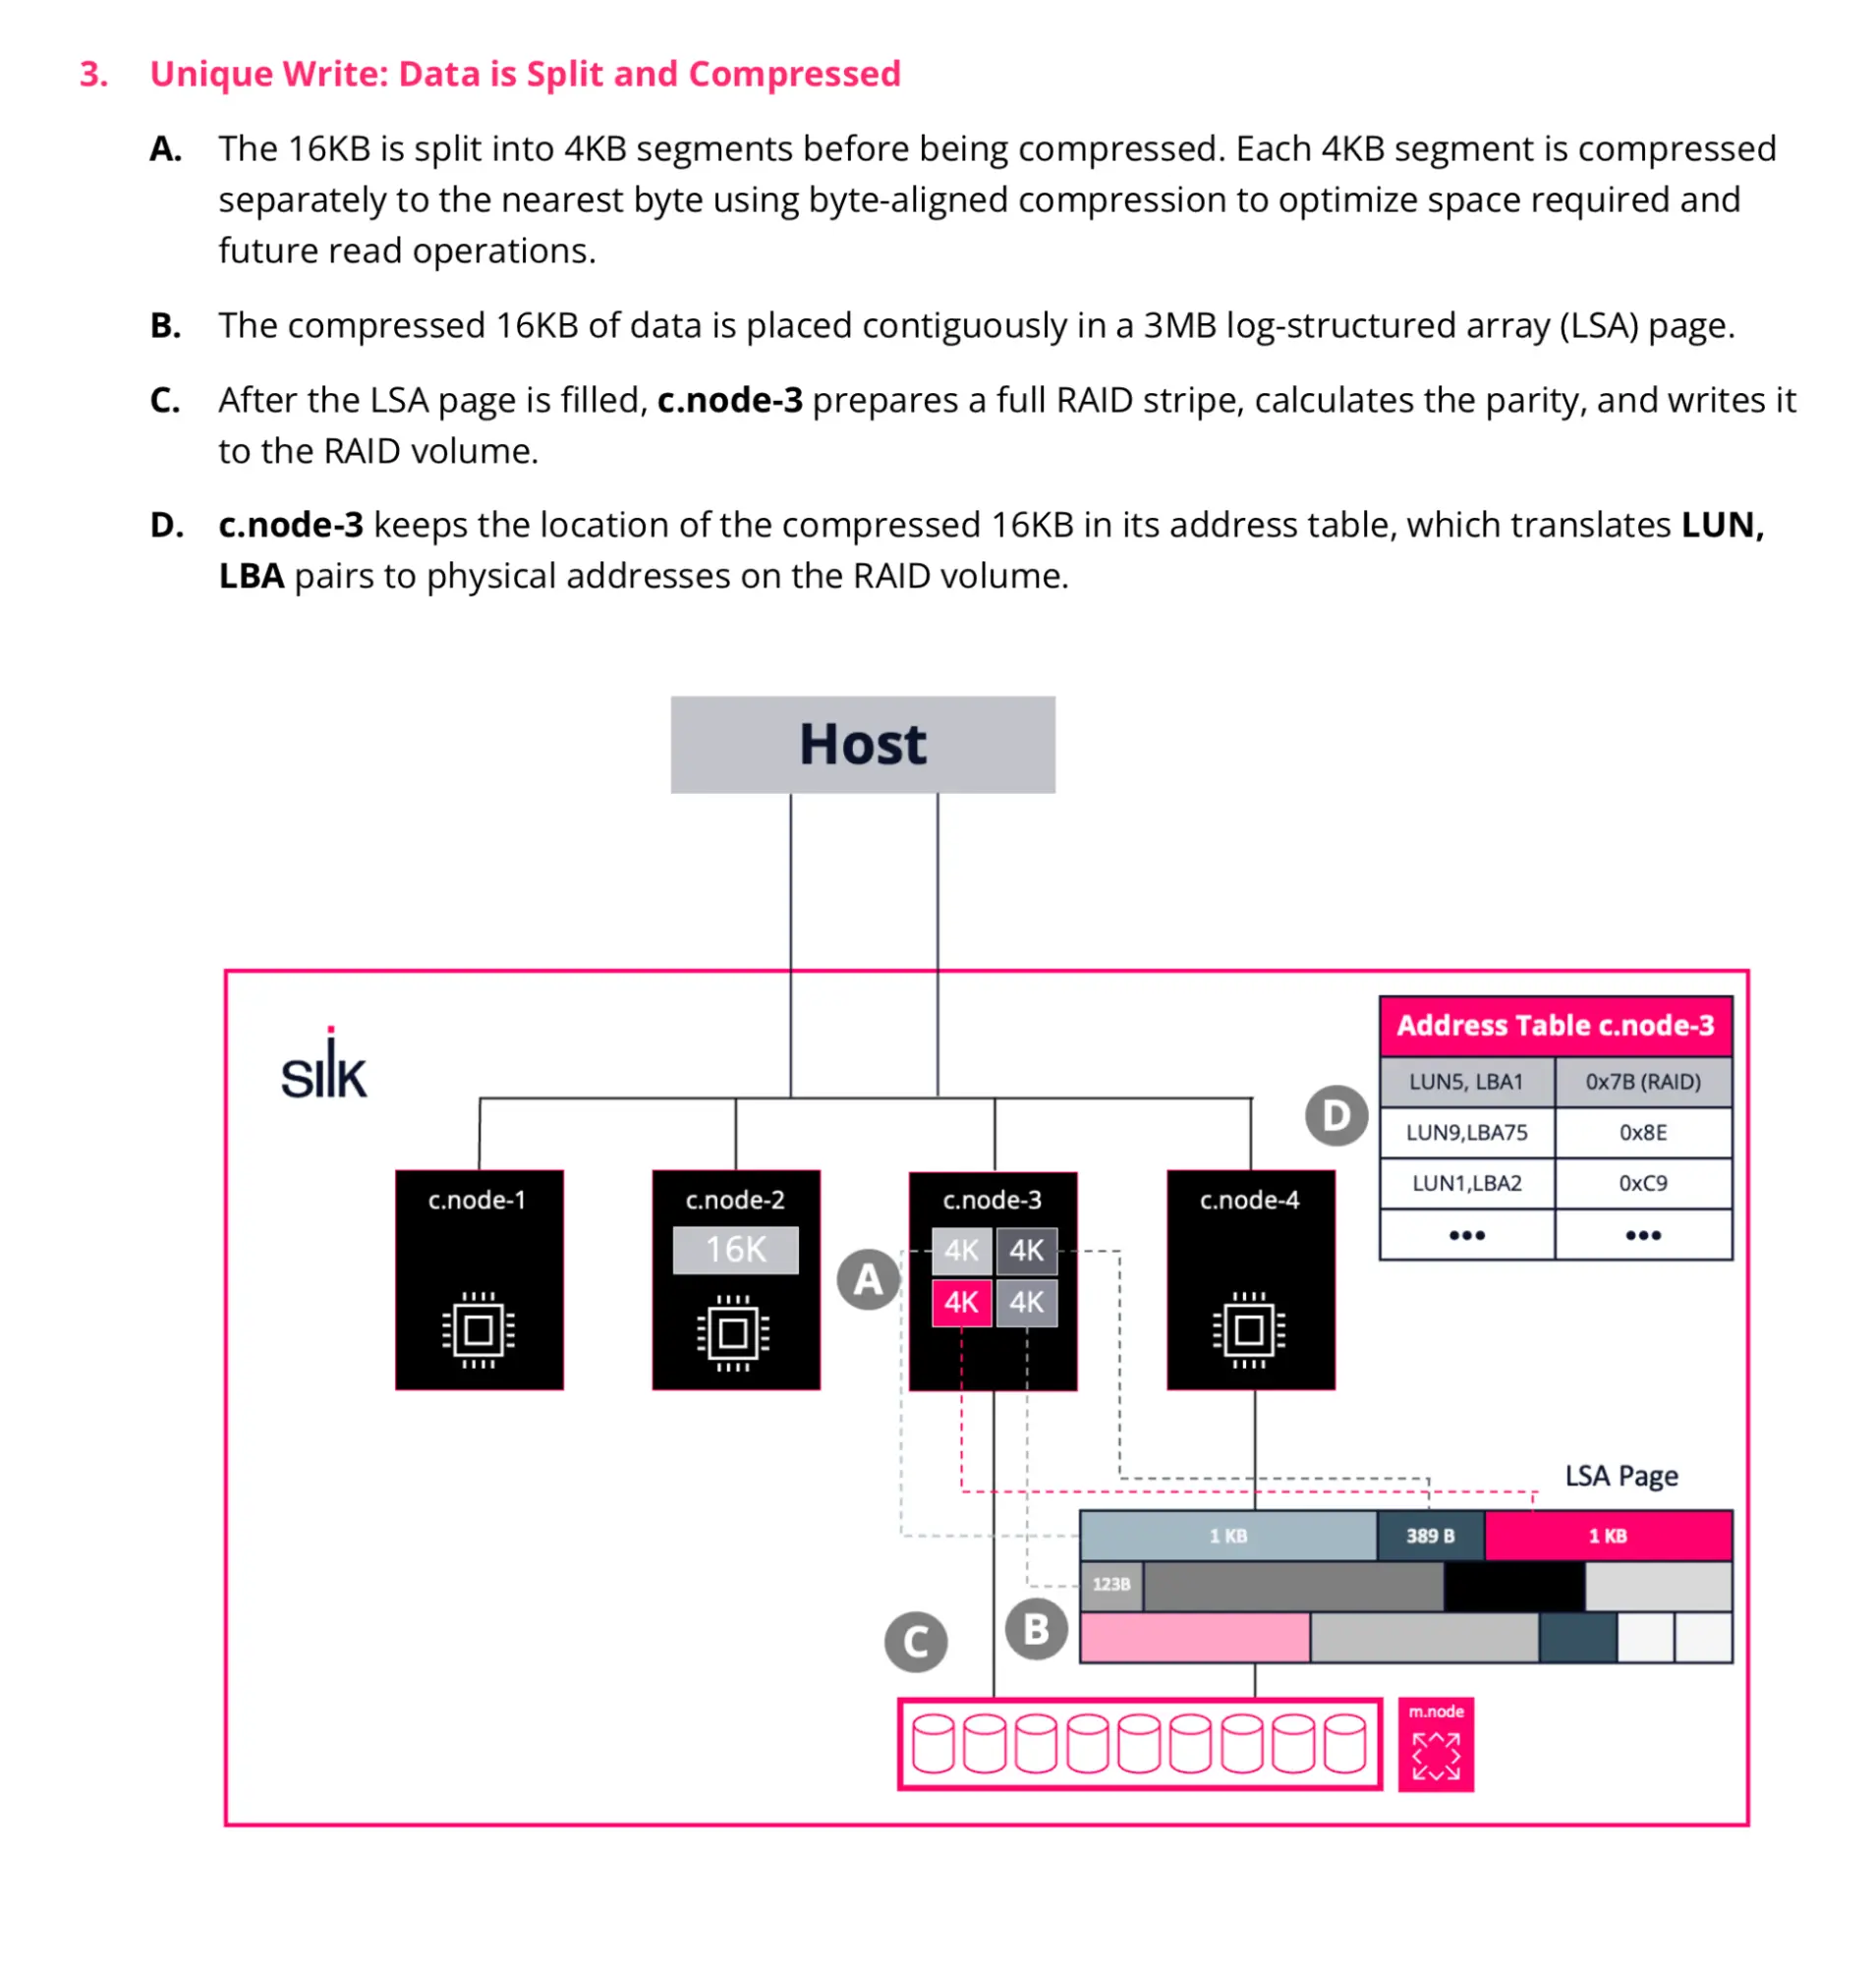
To give you an example, I’m pasting one I/O flow diagrams from the Silk architecture guide here:
Next, I’ll step a couple of layers higher in the stack and write about testing Silk with Postgres 17 and pgvector benchmarks and later on with Google’s AlloyDB Omni (Postgres compatible) database too.
