Update: Just as I started blogging about the Optane technology, it turns out that Intel is shutting down the Optane business (after bringing the latest-gen “Crow Pass” Optane memory to market - probably just for satisfying existing commitments). While not exactly the same thing, keep an eye on the new CXL standard developments to see where the data center/cloud infrastructure world is going (CXL is basically cache-coherent disaggregated memory access protocol via PCIe5.0+).
Part 1 [this post], part 2.
Introduction
- Introduction
- My home lab Optane setup
- Testing Oracle commit latency
- OS-level view
- Oracle metrics
- New log writing behavior internals
- Summary
There will be multiple posts in this series. In this post I will focus on Oracle’s use of Optane Persistent Memory (PMEM) for fast transaction log data flushes (persisting data from redo log buffer to “disk”). There’s more than just the log buffer flush on the critical path of a transaction commit, like messaging and wakeups between the Log Writer and the database connection (foreground) process, I will cover this in the next part.
I will use generic terminology in the first part of this article, for the non-Oracle database users who read this (but later on will get into some Oracle-specific metrics and traces).
My Home Lab Optane Setup
I bought a few Intel Optane persistent memory modules a year ago and finally found time to play with them. Intel has confusing naming for their Optane products, some items are PCIe/NVMe SSDs using the 3DXPoint flash technology, some items (like Optane Memory H10) are just regular NAND flash SSDs, with a bit of 3DXPoint cache built into them for lower latency.
In this article, I am not talking about these solid state disk products, but the actual Optane memory modules that you put into the DIMM sockets of your computer. Your CPUs will directly talk to these memory modules as if they were regular RAM, benefit from CPU caches and not have to go through some block device/NVMe/SCSI interface and interrupt handling at all. Intel calls these modules DCPMMs - Data Center Persistent Memory Modules.
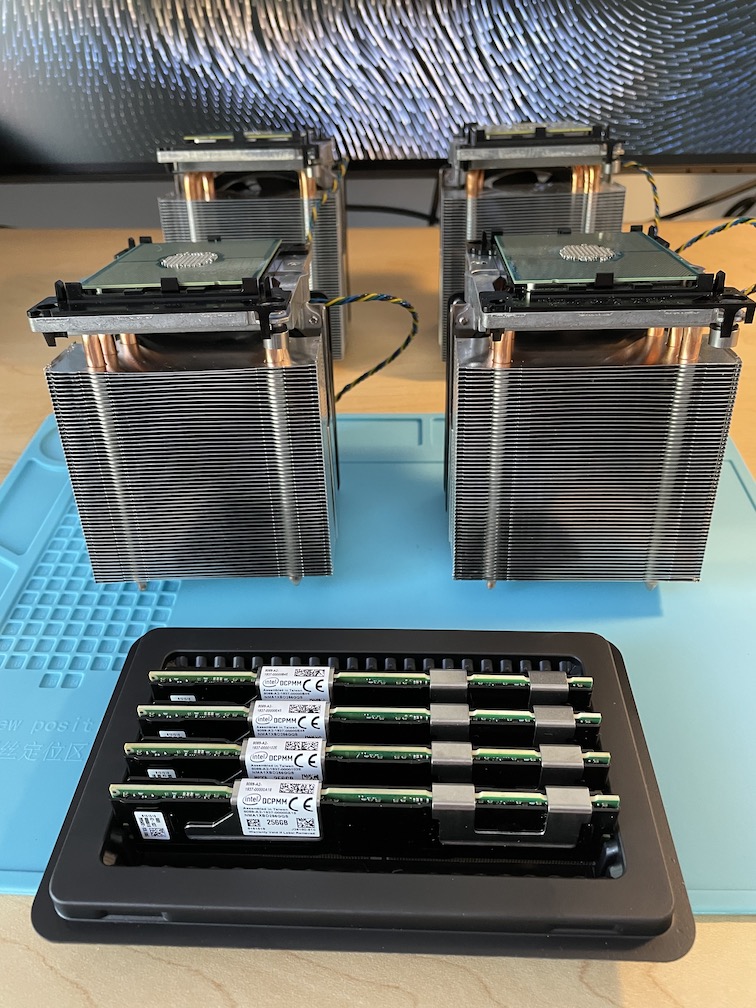
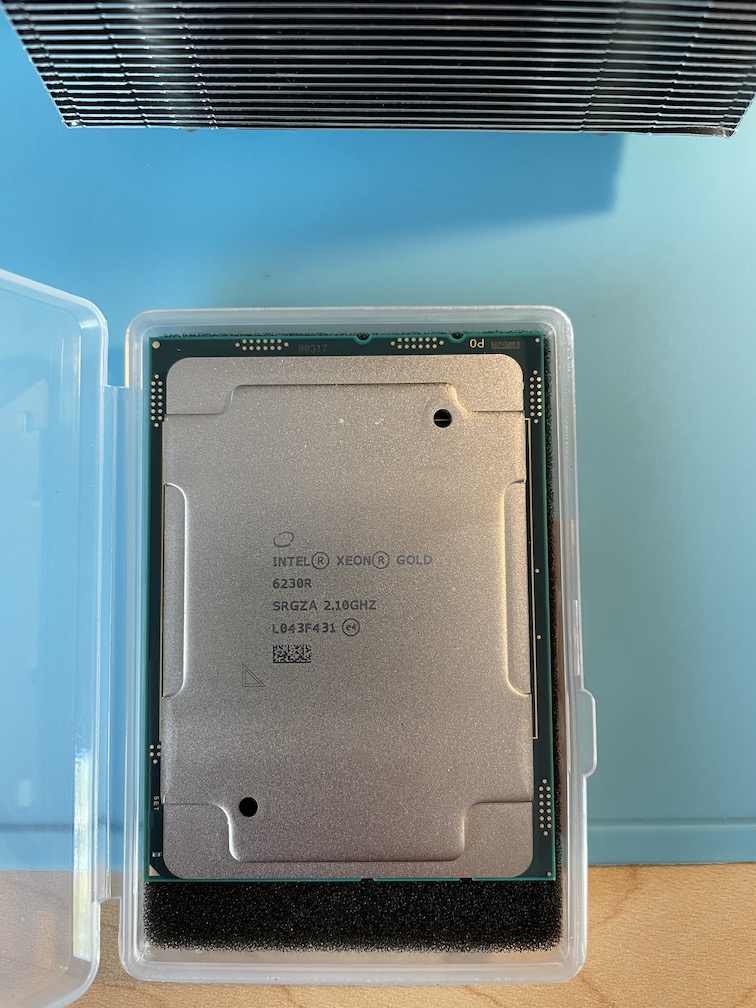
I bought some (hopefully) unused Optane DCPMMs from eBay, but before that I had to figure out if my home server (Lenovo ThinkStation P920) would even support them. It turned out that while the motherboard supported Optane memory, my Xeon Scalable Gen 1 CPUs did not. So I had to also buy 2 x Intel Xeon Gold Scalable 2nd Gen CPUs that support Optane - not all CPU models do. As an added benefit, now I have 52 CPU cores/104 threads in that machine for maximum awesomeness when testing performance stuff :-)

|

|
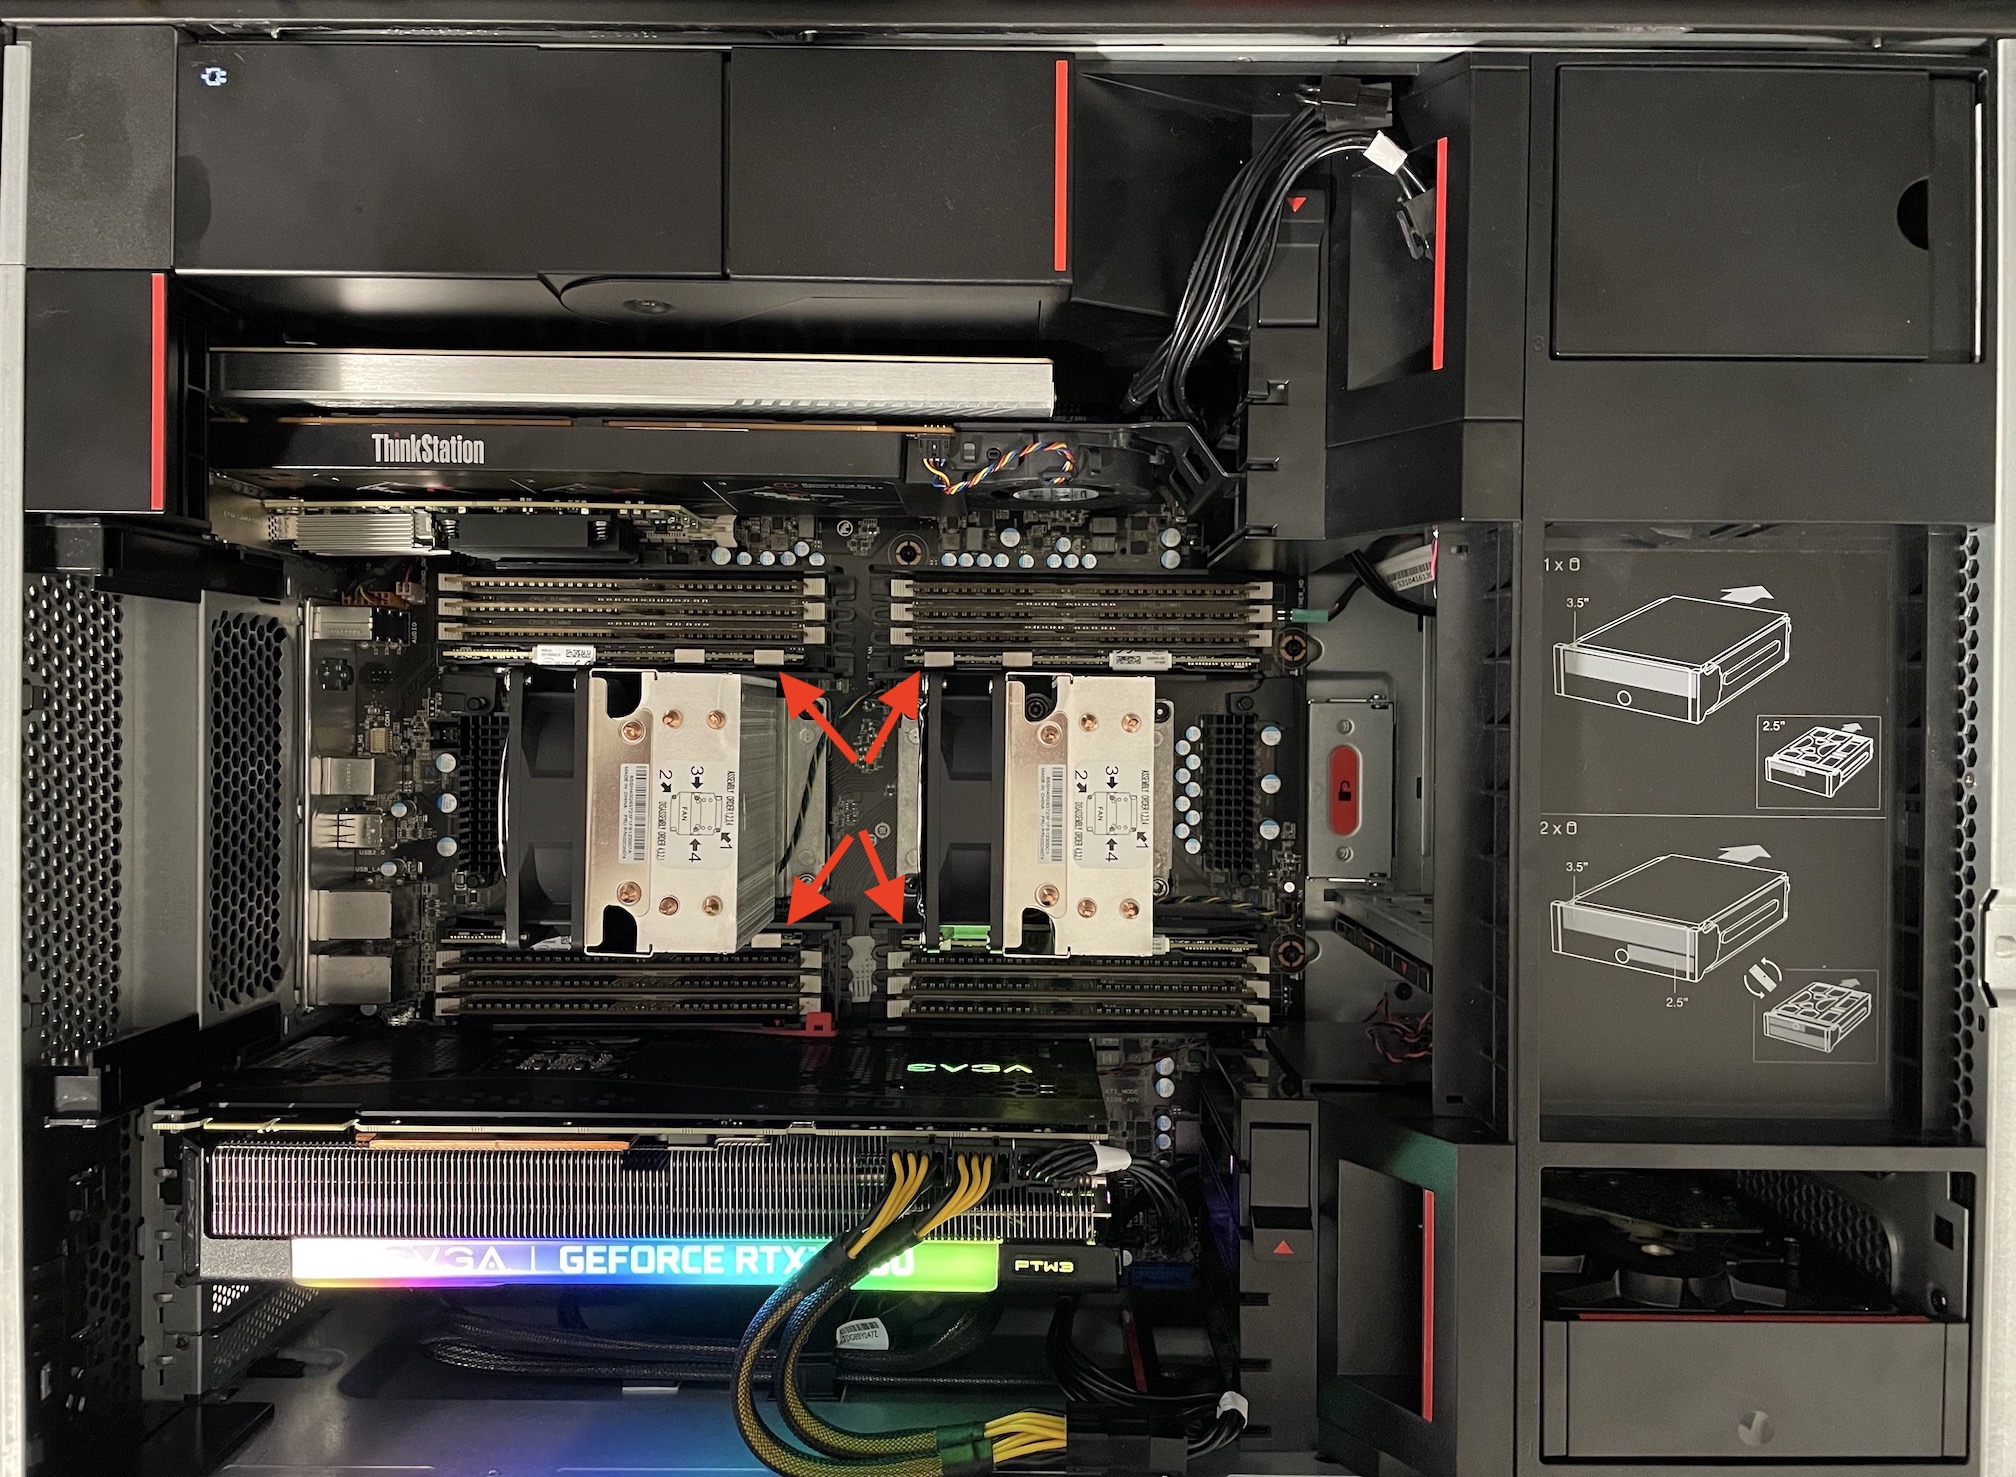
The motherboard has 16 DIMM slots, 12 are currently used for regular DRAM DIMMs and 4 (the closest ones to the CPUs) have Optane DCPMMs in them:

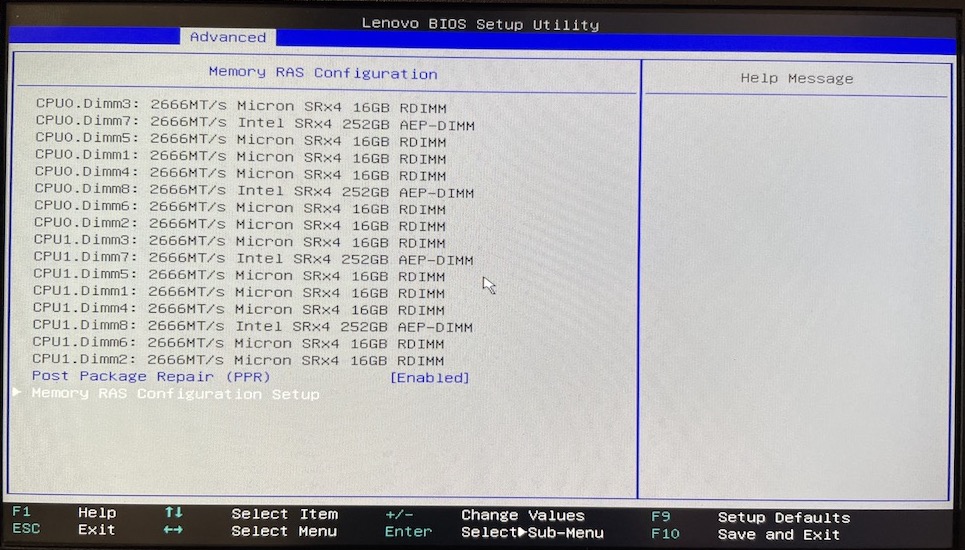
Once I booted the machine up, BIOS showed me the following setup: 12 x Micron DRAM DIMMs (192 GB of RAM) + 4 x Intel AEP-DIMMs (1 TB of PMEM):

AEP is short for Intel’s “Apache Pass” codename. I’m using the “Optane Persistent Memory 100” Gen1 DCPMMs, but newer CPUs and servers (Xeon Scalable 3rd gen) support Intel’s “Optane Persistent Memory 200” Gen2 too (Gen2 has even lower access latency).
There are a few different ways you can use this persistent memory. You could enable a setting in BIOS that presents all this persistent memory to the OS as regular RAM and the OS won’t even know that some of it is DRAM and some is the slower PMEM, but this feels like cheating (and may cause interesting latency issues when things go wrong). I don’t want to duplicate the numerous documents and explanations out there, so you might want to read some of these articles too 1 2 3 4 5.
I configured my BIOS to use only the AppDirect mode. In other words, the OS doesn’t think these modules are regular RAM and won’t use them for its purposes, but applications and Optane-aware filesystems (DAX capability) can explicitly map Optane memory into their address space and still use it like regular memory. To use the Optane memory optimally, parts of your application need to be rewritten so that they avoid system calls, block layer, etc when accessing these memory modules. The “perfect application” would just use one big address space of virtual memory, but some address ranges are physically backed by DRAM, some by Optane PMEM and “I/O” is done just via regular CPU register based memory access or a higher level abstraction like memcpy.
As the whole persistent memory concept is new to some, I’ll repeat the same thought from another angle: With persistent memory, your application’s code will just use regular CPU instructions that read from, write to the persistent memory as needed, follow pointers there, etc. There’s no need for any
pread64/pwrite64system calls to first move persistent data from a disk to addressable memory, the PMEM physical storage itself is memory-addressable. And importantly, PMEM is also cached in the CPU caches and managed across caches on different CPUs, like with regular DRAM.
Optane PMEM is also byte addressable, no need to read the whole 512B/4K “sector” from the storage, but rather just the (typically 64B) cache line. This could be great for any new applications designed for Optane, like using some giant graph that needs to be walked through by just fetching pointers to the next graph node in a loop.
Your traditional applications can benefit from Optane without any modification too, but you can’t naively treat PMEM like fast block storage without some configuration first. Thanks to potential write-caching in CPU caches and the fact that PMEM writes guarantee atomicity for only 8 bytes at a time, you either need a special Optane aware filesystem that does the extra work for guaranteeing block-level atomicity and/or configure some parts of your PMEM to use “sector mode”. This is because in the fastest, AppDirect “fsdax” mode, PMEM writes are just memcpy operations relying on your CPU registers & cache infrastructure under the hood.6
Oracle 21c is the first Oracle database version that can use Optane PMEM in its native, best-performance mode without any block-level emulation layers needed in between. It is possible to benefit from Optane with Oracle 19c too (and probably even earlier versions, by using VMWare volumes on Optane - I haven’t tested this yet). Note that Oracle Exadata uses Optane memory in a completely different way from stand-alone databases that I’m testing here. Oracle on Exadata uses RDMA reads/writes from DB nodes to multiple storage cell nodes - and they are done using RDMA access directly using network cards talking to each other (and accessing remote machines’ memory, including PMEM) - without even involving the OS kernel and system calls! This allows you to read a 8kB database block from a remote storage cell in this distributed Exadata storage layer in 19 microseconds :-) I’ll write more about that some other day, for now you can read this article 5.
Testing Oracle Commit Latency
Now that we are done with the basic intro, let’s look at the key parts of my Oracle-side setup. I’m focusing only on fast commits here and have not configured any other areas (like buffer caching) to use Optane PMEM. All my scripts are available in my Oracle Troubleshooting & Performance Tuning scripts repo as usual.
Let’s check what’s my redo log (transaction log) layout:
SQL> @log
Show redo log layout from V$LOG, V$STANDBY_LOG and V$LOGFILE...

    GROUP#    THREAD#  SEQUENCE#      BYTES  BLOCKSIZE    MEMBERS ARC STATUS                FIRST_CHANGE# FIRST_TIME                    NEXT_CHANGE# NEXT_TIME               CON_ID
---------- ---------- ---------- ---------- ---------- ---------- --- ---------------- ------------------ ------------------- ---------------------- ------------------- ----------
         4          1        337 1073741824        512          1 NO  ACTIVE                    728861906 2022-04-14 22:00:40              731821052 2022-04-14 23:40:17          0
         5          1        338 1073741824        512          1 NO  CURRENT                   731821052 2022-04-14 23:40:17    9295429630892703743                              0
         6          1        335 1073741824        512          1 NO  INACTIVE                  728166382 2022-04-09 16:58:08              728521467 2022-04-12 03:58:57          0
         7          1        336 1073741824        512          1 NO  INACTIVE                  728521467 2022-04-12 03:58:57              728861906 2022-04-14 22:00:40          0


    GROUP# STATUS  TYPE    IS_ MEMBER
---------- ------- ------- --- ----------------------------------------------------------------------------------------------------
         4         ONLINE  NO  /mnt/dax0/daxredo01
         5         ONLINE  NO  /mnt/dax0/daxredo02
         6         ONLINE  NO  /mnt/dax0/daxredo03
         7         ONLINE  NO  /mnt/dax0/daxredo04
As you see, I have 4 x 1 GB redolog files on /mnt/dax0 that is a DAX-aware file system. DAX means Optane Direct-Access capable file system, where any files mapped into a process memory are directly addressable and accessible just like RAM, without having to go through any block layers and storage codepaths. Both the XFS and EXT4 filesystems support the dax feature and mount option on the latest kernels. Read more from the articles referenced in the footnotes.
When Oracle log-switches to using the next redo log, it will check if it’s on a DAX enabled filesystem:
Redo log for group 4, sequence 261 is located on DAX storage
Thread 1 opened at log sequence 261
  Current log# 4 seq# 261 mem# 0: /mnt/dax0/daxredo01
Successful open of redo thread 1
And therefore it will not try to open it as a regular file, but rather maps it into the Log Writer (LGWR) process address space.
OS level view
Here’s the memory map of LGWR:
$ sudo pmap -x 10681
10681:   ora_lgwr_LIN21C
Address           Kbytes     RSS   Dirty Mode  Mapping
0000000000400000  422488   59612       0 r-x-- oracle
000000001a295000    1544     760      12 r---- oracle
000000001a417000     468     168      24 rw--- oracle
000000001a48c000     344     192     192 rw---   [ anon ]
000000001af54000     316     280     280 rw---   [ anon ]
0000000060000000   10240       0       0 rw-s- SYSV00000000 (deleted)
0000000061000000 7585792       0       0 rw-s- SYSV00000000 (deleted)
0000000230000000   90112       0       0 rw-s- SYSV00000000 (deleted)
0000000236000000      80       4       4 rw-s-   [ shmid=0x4 ]
00007fa849c00000 1048580       4       4 rw-s- daxredo01
00007fa889e00000 1048580       4       4 rw-s- daxredo04
00007fa8ca000000 1048580       4       4 rw-s- daxredo03
00007fa90a200000 1048580     792     792 rw-s- daxredo02
00007fa94a300000      64      24      24 rw---   [ anon ]
00007fa94a310000     960       0       0 rw---   [ anon ]
00007fa98a487000    1024     524     524 rw---   [ anon ]
00007fa98a587000     512     476     476 rw---   [ anon ]
00007fa98a607000     512      24      24 rw---   [ anon ]
00007fa98a687000   11076     444       0 r-x-- libshpkavx512.so
00007fa98b158000    2048       0       0 ----- libshpkavx512.so
00007fa98b358000     132     132     132 r---- libshpkavx512.so
00007fa98b379000      20      20      20 rw--- libshpkavx512.so
00007fa98b37e000    2304    1116    1116 rw---   [ anon ]
...
As you see, LGWR has mapped all 4 redo log files into its address space and since these files reside on the DAX-aware filesystem on Optane, the log writer can persist data into the PMEM by just regular CPU register-based memory writes and memcpy. No system calls are needed!
I started a couple of sessions that ran my lotscommits.sql scripts that just do lots of tiny updates + commits in a loop and then ran strace on the LGWR process:
$ sudo strace -cp 10681
strace: Process 10681 attached
^Cstrace: Process 10681 detached
% time     seconds  usecs/call     calls    errors syscall
------ ----------- ----------- --------- --------- ----------------
 98.68    0.308608           1    216943           getrusage
  1.32    0.004120           1      2428           semtimedop
------ ----------- ----------- --------- --------- ----------------
100.00    0.312728                219371           total
No I/O system calls show up at all. Normally you’d see a bunch of io_submit and io_getevents system calls when running on regular file systems & block devices.
Oracle metrics
So, what kind of write latencies do we see? There’s no point in running iostat or blktrace as these tools measure only block device I/O, which our PMEM “I/O” requests are not using. Luckily, the Oracle Database has “application level” instrumentation for this stuff - wait events, so we don’t have to start tracing function call boundaries as the first step.
Oracle’s wait events are not perfect, especially when dealing with lots of microsecond-scale low latency events and asynchronous I/O, but I’ll avoid going deeper into that rabbit-hole in this post and just look at what numbers Oracle reports.
You’ll need to scroll down and right to see the average “log file write” latency numbers reported by my Snapper tool:
SQL> @snapper all 5 1 lgwr
Sampling SID lgwr with interval 5 seconds, taking 1 snapshots...

-- Session Snapper v4.33 - by Tanel Poder ( https://tanelpoder.com/snapper ) - Enjoy the Most Advanced Oracle Troubleshooting Script on the Planet! :)

-----------------------------------------------------------------------------------------------------------------------------------------------------------------------------------------
    SID, USERNAME  , TYPE, STATISTIC                           ,         DELTA, HDELTA/SEC,    %TIME, GRAPH       , NUM_WAITS,  WAITS/SEC,   AVERAGES
-----------------------------------------------------------------------------------------------------------------------------------------------------------------------------------------
   4841, (LGWR)    , STAT, non-idle wait time                  ,            33,       6.44,         ,             ,          ,           ,          ~ per execution
   4841, (LGWR)    , STAT, non-idle wait count                 ,        230944,     45.05k,         ,             ,          ,           ,          ~ per execution
   4841, (LGWR)    , STAT, in call idle wait time              ,           333,      64.96,         ,             ,          ,           ,          ~ per execution
   4841, (LGWR)    , STAT, messages received                   ,        130834,     25.52k,         ,             ,          ,           ,          ~ per execution
   4841, (LGWR)    , STAT, background timeouts                 ,             2,        .39,         ,             ,          ,           ,          ~ per execution
   4841, (LGWR)    , STAT, enqueue requests                    ,        115458,     22.52k,         ,             ,          ,           ,          ~ per execution
   4841, (LGWR)    , STAT, enqueue releases                    ,        115458,     22.52k,         ,             ,          ,           ,          ~ per execution
   4841, (LGWR)    , STAT, physical read total IO requests     ,        115458,     22.52k,         ,             ,          ,           ,        512 bytes per request
   4841, (LGWR)    , STAT, physical read total bytes           ,      59113984,     11.53M,         ,             ,          ,           ,          ~ per execution
   4841, (LGWR)    , STAT, physical write total IO requests    ,        230930,     45.05k,         ,             ,          ,           ,     767.56 bytes per request
   4841, (LGWR)    , STAT, physical write total bytes          ,     177252864,     34.58M,         ,             ,          ,           ,          ~ per execution
   4841, (LGWR)    , STAT, cell physical IO interconnect bytes ,     236366848,     46.11M,         ,             ,          ,           ,          ~ per execution
   4841, (LGWR)    , STAT, Session total flash IO requests     ,        346387,     67.58k,         ,             ,          ,           ,          ~ per execution
   4841, (LGWR)    , STAT, calls to kcmgas                     ,        130832,     25.52k,         ,             ,          ,           ,          ~ per execution
   4841, (LGWR)    , STAT, redo wastage                        ,      34365120,       6.7M,         ,             ,          ,           ,          ~ per execution
   4841, (LGWR)    , STAT, redo write active strands           ,        115470,     22.53k,         ,             ,          ,           ,          ~ per execution
   4841, (LGWR)    , STAT, redo writes                         ,        115457,     22.52k,         ,             ,          ,           ,          ~ per execution
   4841, (LGWR)    , STAT, redo blocks written                 ,        230742,     45.02k,         ,             ,          ,           ,          ~ per execution
   4841, (LGWR)    , STAT, redo write size count (   4KB)      ,        115457,     22.52k,         ,             ,          ,           ,          ~ per execution
   4841, (LGWR)    , STAT, redo write time                     ,            55,      10.73,         ,             ,          ,           ,          ~ per execution
   4841, (LGWR)    , STAT, redo write time (usec)              ,        543949,    106.12k,         ,             ,          ,           ,     4.71us per redo write
   4841, (LGWR)    , STAT, redo write gather time              ,        267351,     52.16k,         ,             ,          ,           ,     2.32us per redo write
   4841, (LGWR)    , STAT, redo write schedule time            ,        309461,     60.37k,         ,             ,          ,           ,     2.68us per redo write
   4841, (LGWR)    , STAT, redo write issue time               ,        315277,     61.51k,         ,             ,          ,           ,     2.73us per redo write
   4841, (LGWR)    , STAT, redo write finish time              ,        538028,    104.96k,         ,             ,          ,           ,     4.66us per redo write
   4841, (LGWR)    , STAT, redo write total time               ,       1061960,    207.18k,         ,             ,          ,           ,      9.2us per redo write
   4841, (LGWR)    , TIME, background cpu time                 ,       2470047,   481.88ms,    48.2%, [#####     ],          ,           ,
   4841, (LGWR)    , TIME, background elapsed time             ,       2105291,   410.72ms,    41.1%, [#####     ],          ,           ,         -6 % unaccounted-for time*
   4841, (LGWR)    , WAIT, rdbms ipc message                   ,       3327894,   649.24ms,    64.9%, [WWWWWWW   ],    130833,     25.52k,    25.44us average wait
   4841, (LGWR)    , WAIT, log file parallel write             ,        112382,    21.92ms,     2.2%, [W         ],    115467,     22.53k,      .97us average wait
   4841, (LGWR)    , WAIT, log file pmem persist write         ,        217121,    42.36ms,     4.2%, [W         ],    115467,     22.53k,     1.88us average wait
   4841, (LGWR)    , WAIT, events in waitclass Other           ,            17,     3.32us,      .0%, [          ],        17,       3.32,        1us average wait
   ...

--  End of Stats snap 1, end=2022-04-14 23:41:25, seconds=5.1


---------------------------------------------------------------------------------------------------------------
  ActSes   %Thread | INST | SQL_ID          | SQL_CHILD | EVENT                               | WAIT_CLASS
---------------------------------------------------------------------------------------------------------------
     .29     (29%) |    1 |                 | 0         | ON CPU                              | ON CPU
     .08      (8%) |    1 |                 | 0         | log file parallel write             | System I/O
     .06      (6%) |    1 |                 | 0         | log file pmem persist write         | System I/O

--  End of ASH snap 1, end=2022-04-14 23:41:25, seconds=5, samples_taken=48, AAS=.4
The average duration of the log file parallel write wait event is 0.97 microseconds! Or 970 nanoseconds, if that sounds fancier to you! This is the “memcpy” (actually __intel_avx_rep_memcpy) from log buffer (DRAM) to the redo log file residing in the persistent memory (PMEM). The memory copy is followed by a sfence instruction call, to avoid any write ordering and cache coherency issues.
Note that since no disk I/O is involved in these “wait” events on PMEM, these timings show just the CPU time it took to complete the memcpy() loop and following clwb (cache line write-back) CPU instructions to ensure that the data actually lands in the Optane Memory modules or in a power-fail protected domain.
New log writing behavior internals
But what is that other wait event - log file pmem persist write?
We can use the old “KSFD” I/O tracing event 10298 to get some more insight!
SQL> @oerr 10298

ORA-10298: ksfd i/o tracing
Since I needed to enable this event for LGWR and not my own session, I used dbms_system.set_ev() for that, instead of ALTER SESSION. I also enabled SQL Trace for LGWR with dbms_monitor to print the wait event info into the same tracefile:
An excerpt of the I/O trace is below:
WAIT #0: nam='rdbms ipc message' ela= 40 timeout=76 p2=0 p3=0 obj#=-1 tim=1305924607925
ksfdrqfill:rq=0xc0a70ba8 fob=0x102cd1778 tid=9 stblk=420697 flags=8 reason=258
ksfdwrite:fob=0x102cd1778 stblk=420697 bufp=0x230574200 nbytes=1024 time=(nil)
ksfdglbsz:fob=0x2cd1778 bsiz=512 fname: fnamel:0
ksfd_osdrqfil:fob=0x102cd1778 bufp=0x230574200 blkno=420697 nbyt=1024 flags=0x8
WAIT #0: nam='log file parallel write' ela= 3 files=1 blocks=2 requests=1 obj#=-1 tim=1305924607944
ksfdrqfill:rq=0xc0a70ba8 fob=0x102cd1778 tid=9 stblk=1 flags=8 reason=20994
ksfdwrite:fob=0x102cd1778 stblk=1 bufp=0x7fa98fb34000 nbytes=512 time=(nil)
ksfdglbsz:fob=0x2cd1778 bsiz=512 fname: fnamel:0
ksf_dax_nonatomic: Redo log on PMEMFS 15
ksfdglbsz:fob=0x2cd1778 bsiz=512 fname: fnamel:0
ksfdread:fob=0x102cd1778 stblk=1 bufp=0x7fa98fb79000 nbytes=512 time=(nil)
ksfdglbsz:fob=0x2cd1778 bsiz=512 fname: fnamel:0
ksf_dax_nonatomic: Redo log on PMEMFS 15
ksfdgfnm:fob=0x2cd1778
ksfd_osdrqfil:fob=0x102cd1778 bufp=0x7fa98fb79000 blkno=1 nbyt=512 flags=0x4
ksfdglbsz:fob=0x2cd1778 bsiz=512 fname: fnamel:0
ksfd_dax_redo_io: daxhwm update using blk 1
ksfd_dax_redo_io: write hwm 488, header 1
ksfd_io: special io 20994 update completed 2 IOs
WAIT #0: nam='log file pmem persist write' ela= 19 thread=1 group=4 member=1 obj#=-1 tim=1305924607976
WAIT #0: nam='rdbms ipc message' ela= 43 timeout=76 p2=0 p3=0 obj#=-1 tim=1305924608028
The ksfd_dax_redo_io lines just before the log file pmem persist write wait event show that this wait event is about updating some sort of a high water mark (HWM) in the the redo log file header (blk 1).
Since the PMEM is just memory (cached by CPUs) and since it offers atomicity only 8 bytes at a time, an extra step is needed to confirm (or commit) the log file write. In other words, the log file parallel write is a memcpy() operation and the log file pmem persist write is just a simple HWM update in the redolog file header. This helps to prevent scenarios like “torn blocks” or partially-persisted writes during crashes or hardware errors.
Should there be a crash in the middle of a log file parallel write memcpy() and we end up persisting only, say, 448 bytes out of a 512-byte redolog block size, LGWR never gets to the part of updating the HWM in the redolog header, so a subsequent crash recovery will ignore the partially persisted block. It’s conceptually a little similar to how Oracle’s direct path loads operate - your insert will first dump a bunch of new datablocks above the HWM of your table and then update the HWM to the end of the newly inserted block range on transaction commit.
If you are asking yourself this question: Yes, on PMEM, every redolog write is followed by another write to the redolog file header, to update the HWM. Since that HWM (byte address) value will fit into an atomic 8-byte value, it can be just updated with a register-based memory access and no further “two-phase commit” trickery is needed (note that I didn’t check how that HWM update is actually implemented under the hood).
It’s worth noting that LGWR will acquire the “RP” lock (PMEM resilver/repair enqueue) every time it updates the HWM. It’s possibly useful if multiple LGWR slaves do concurrent I/O against the current redolog file, or perhaps when some sort of recovery/resilvering is needed between multiple redolog mirrors/members (I didn’t test this further).
You could also enable the wait_event[] tracing option (available since Oracle 12c) to see the Oracle kernel stack traces that led up to a wait event. I wouldn’t do any of this tracing in production, as crashing LGWR will take your whole database down:
event="log file parallel write" ela=3 p1=1 p2=2 p3=1
  stack= ksfd_io<-ksfdwrite<-kcrfw_do_write<-kcrfw_redo_write<-kcrfw_redo_write_driver<-ksb_act_run_int<-ksb_act_run<-ksbab
event="log file pmem persist write" ela=6 p1=1 p2=4 p3=1
  stack= ksfd_io<-ksfdwrite<-kcrf_dax_update_hwm<-kcrfw_post<-kcrfw_redo_write<-kcrfw_redo_write_driver<-ksb_act_run_int<-k
Summary
This was a small intro into how Oracle Database 21c is using the Optane PMEM for low latency local commits. I say local commits, because you would still lose data if your server completely crashes, burns down and fails to access the Optane DCPMM modules (either in their original server or other servers where you might install the “damaged” memory modules). So, for proper resilience, you would still need multi-node persistence over network (like Oracle Exadata does) or a disaster recovery “replication” solution with Oracle Data Guard.
Nevertheless, achieving these ultra-low microsecond grade commit latencies is something that no other major database engine has done before - so it was both fun and rewarding to figure out all this works. Also, thanks to Kishy Kumar, who is actually building many of these innovations around transaction commits at Oracle - he was kind enough to review my research results and confirm that my understanding was more-or-less correct.
-
https://blogs.oracle.com/database/post/persistent-memory-primer ↩︎
-
https://docs.oracle.com/en/database/oracle/oracle-database/21/admin/using-PMEM-db-support.html#GUID-A7ACCD50-30BD-49D1-AC34-14F143D4CD6D ↩︎
-
https://blogs.oracle.com/database/post/oracle-21c-persistent-memory-database-direct-mapped-buffer-cache ↩︎
-
https://virtualizingoracle.wordpress.com/2022/02/03/accelerate-oracle-redo-performance-using-intel-optane-dc-pmm-backed-oracle-21c-persistent-memory-filestore-on-vmware-vsphere/ ↩︎
-
https://blogs.oracle.com/exadata/post/persistent-memory-magic-in-exadata ↩︎ ↩︎
-
https://www.intel.com/content/www/us/en/developer/articles/technical/optimizing-write-ahead-logging-with-intel-optane-persistent-memory.html ↩︎
