The Oracle SQL Developer team has released version 18.3 of this tool. My favorite new feature in this version is its ability to save SQL Monitoring reports in HTML format! Adobe Flash is finally not needed for sharing graphical SQL Monitoring reports.
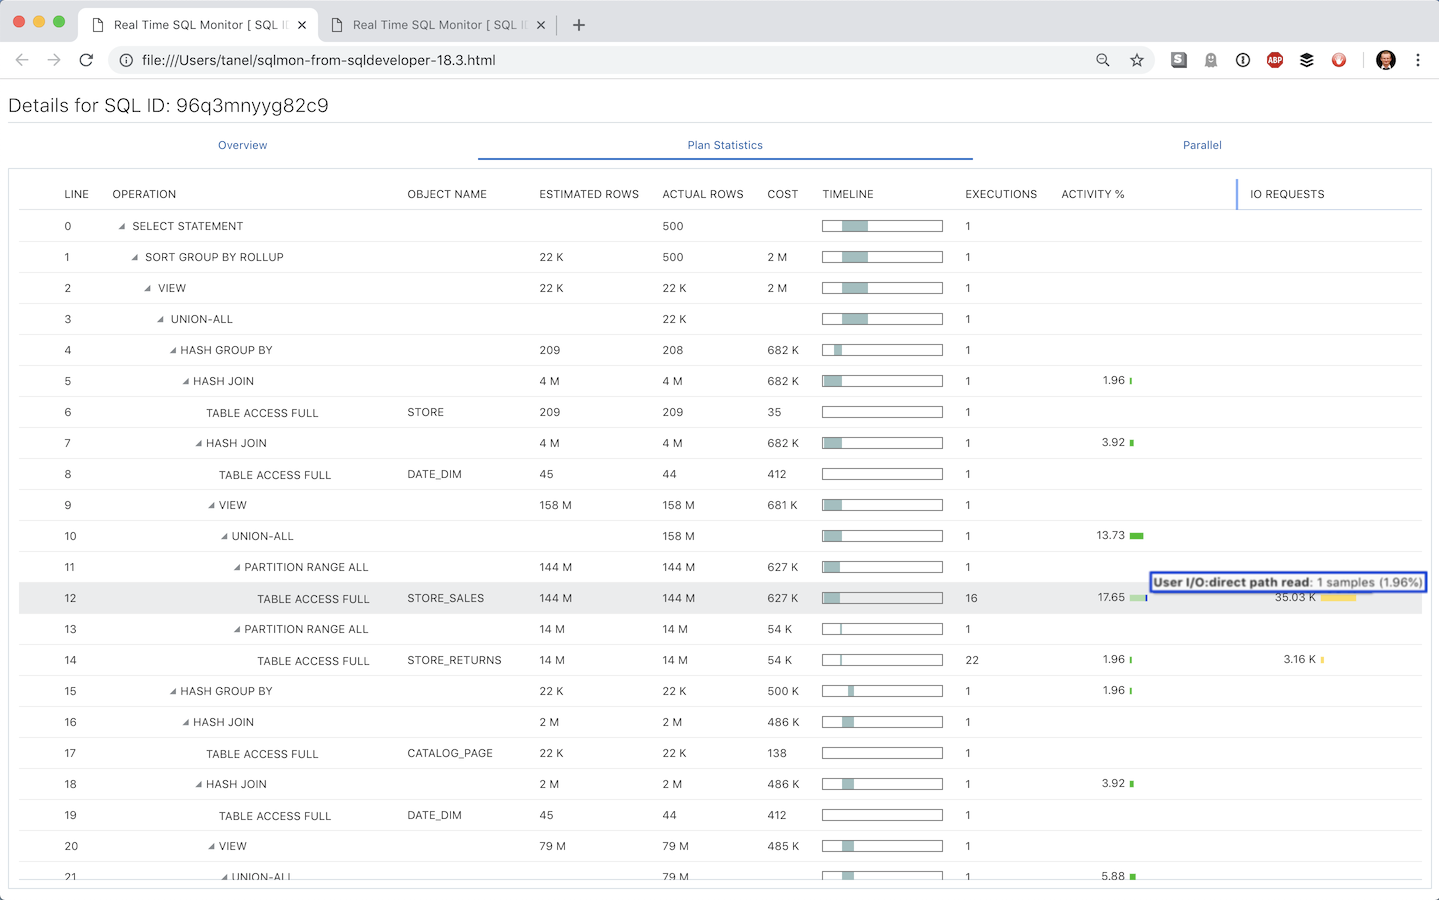
Here’s an example output, it looks pretty nice and clean:

The report is reasonably navigatable, has tooltips (useful for identifying wait classes for example) and you can also rearrange columns by dragging them left or right with your mouse. The developers have helpfully put the ESTIMATED ROWS and ACTUAL ROWS columns next to each other for making identifying optimizer cardinality misestimates easier (btw, in the Flash version you can move columns around too but these two are not side by side by default). The navigation and scrolling is much smoother as there’s no Flash plugin and iframe/embed in the way.
You can download the example SQL Monitoring HTML report from here. Or better yet, go download the SQL Developer 18.3 from Oracle website and try it out yourself.
If you can’t find the button for saving a SQL Monitoring report to HTML, check out this helpful tweet here (there’s a UI icon bug that will get fixed in 18.4):
Save As Report (Ctrl+R) pic.twitter.com/QCwjG4ErMh
— Oracle SQL Developer (@OracleSQLDev) October 10, 2018
Now we just need to hope that this functionality finds its way to the Oracle Database (and EM Cloud Control) itself and some day (year) we could finally get rid of Flash for good. Or perhaps we could use it in sqlcl sooner - whenever need to automate & script generation of SQL Monitoring reports.
An alternative (and old) way to get HTML reports
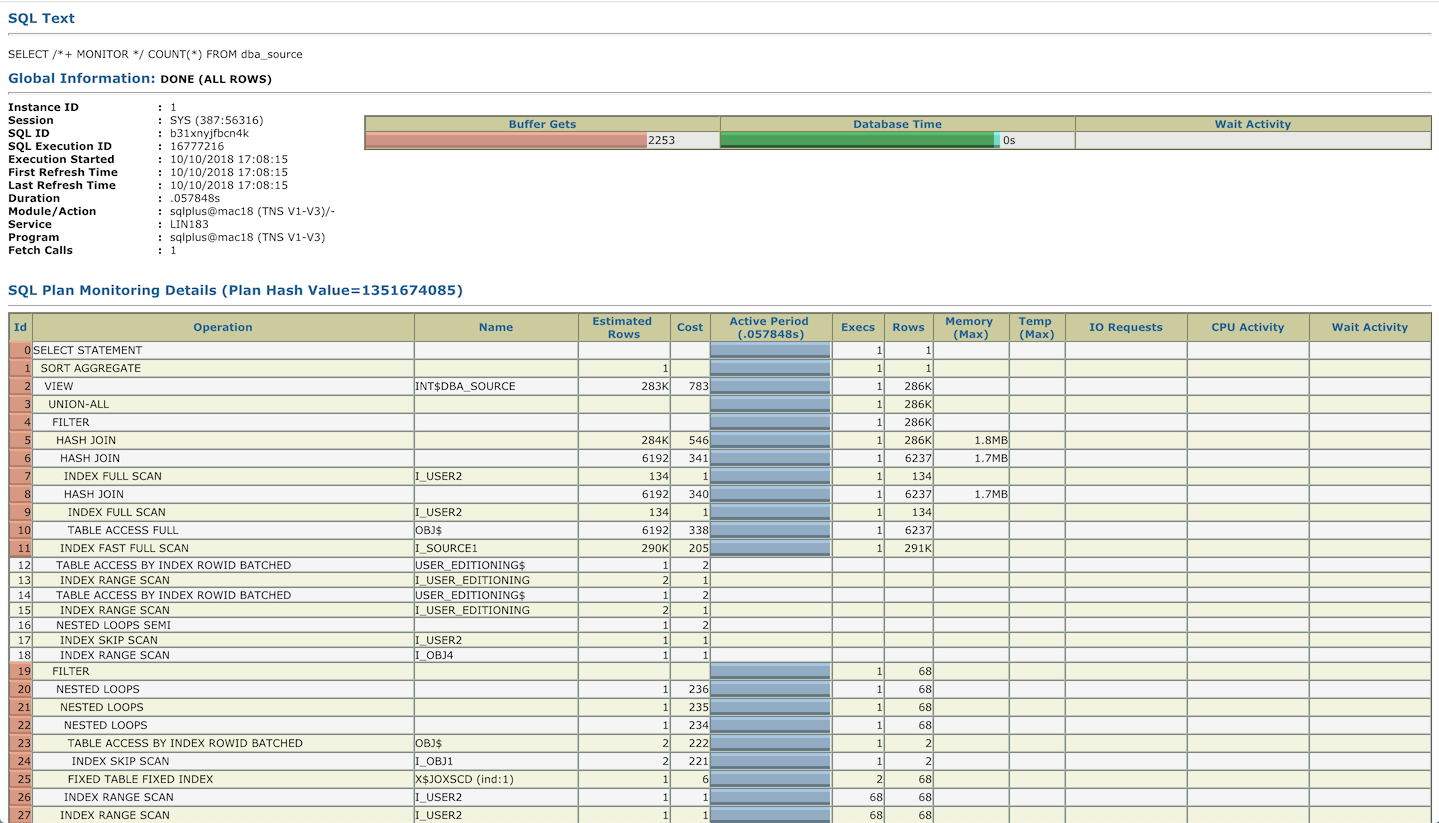
It’s worth mentioning that there actually has been an HTML format option for SQL Monitoring reports since Oracle 11.1, but it’s pretty static, not really navigatable and the layout is somewhat broken with large plans. Nice and colorful though:

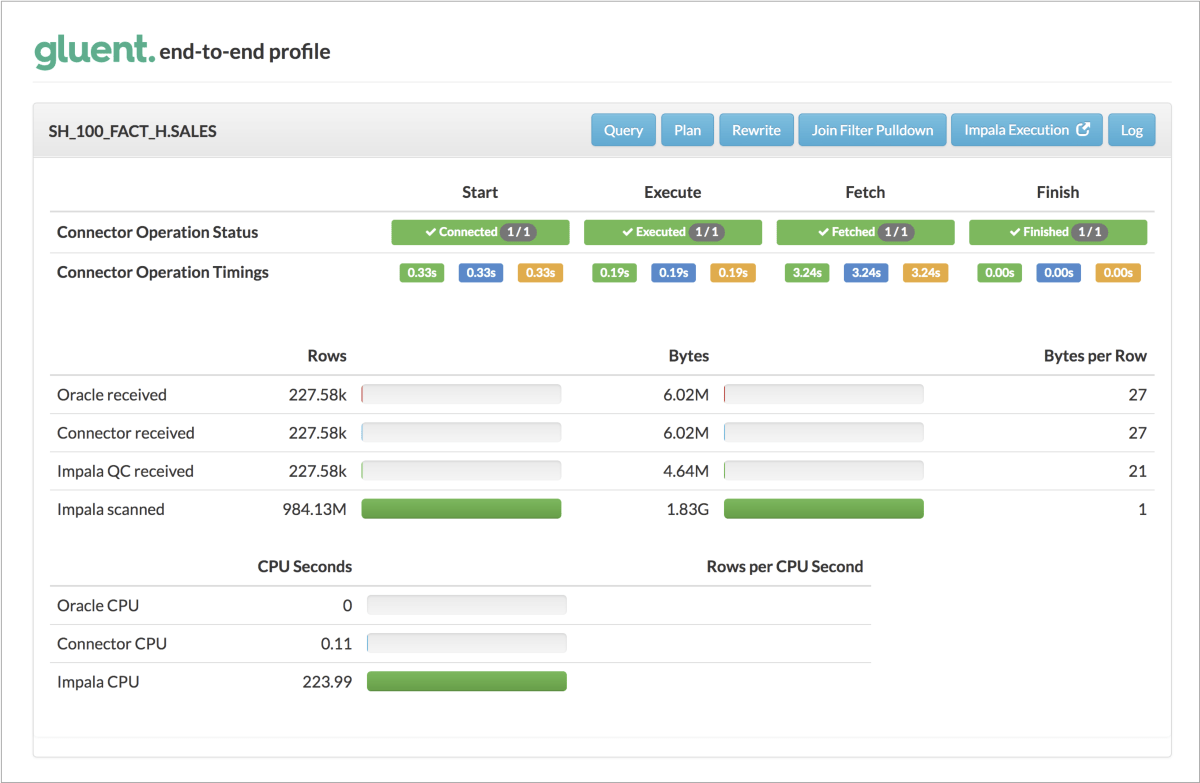
And finally I’ll mention that at Gluent we built an augmented SQL Monitoring report multiple years ago, for easy overview of how Gluent’s data virtualization queries perform across processing layers and what happens in the actual backend where Gluent transparently pushes the work to. We currently still use the standard Flash report for Oracle stuff and spool it into a HTML file. And then append the navigatable Gluent add-on section (with Hadoop/Cloud backend activity) into the end of the HTML so we have the end to end view nicely in a single report. Now that Oracle folks have a nice-looking HTML report available in SQL Developer, perhaps it will show up in other Oracle’s products too and we won’t have to write one ourselves ;-)

Summary
In summary, go and download Oracle SQL Developer 18.3, it’s an awesome tool built by people who know and care about practical usability. And it’s free!
Comments are currently in Twitter.
