I was recently involved in troubleshooting an interesting performance issue with some non-intuitive background process & wait event behavior. I reproduced the problem in my own custom-tailored environment (Oracle 18.3 on Linux), here’s the starting point:
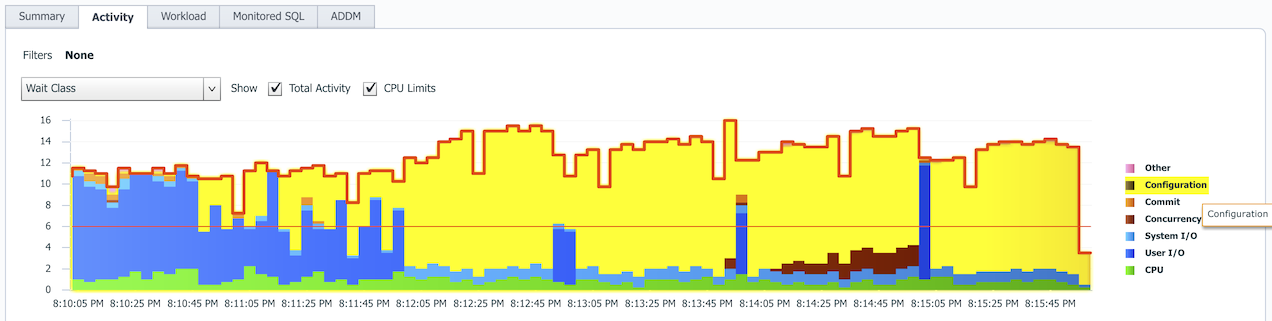
After starting a transaction-heavy benchmark, soon after the transaction rate drops and the database sessions are mostly waiting for some Configuration wait class events, instead of getting work done.
Just looking into the high level wait class names is not enough, so let’s drill down with ashtop.sql to see more:
SQL> @ashtop wait_class,event2 1=1 sysdate-1/24/12 sysdate

    Total
  Seconds     AAS %This   WAIT_CLASS      EVENT2
--------- ------- ------- --------------- -----------------------------------------
     3379    11.3   75% | Configuration   log file switch (checkpoint incomplete)
      275      .9    6% | System I/O      db file parallel write
      273      .9    6% |                 ON CPU
      204      .7    5% | User I/O        db file sequential read
       84      .3    2% | Configuration   log file switch completion
       82      .3    2% | Concurrency     buffer busy waits [undo header]
       80      .3    2% | Concurrency     buffer busy waits [data block]
       49      .2    1% | User I/O        direct path write
       48      .2    1% | Other           enq: CF - contention [mode=5]
       11      .0    0% | Other           LGWR all worker groups
       10      .0    0% | Application     enq: KO - fast object checkpoint [mode=6]
        9      .0    0% | System I/O      control file sequential read
        7      .0    0% | User I/O        db file parallel read
        6      .0    0% | System I/O      log file parallel write
        5      .0    0% | Commit          log file sync
Ok, most of the database time is spent waiting on the log file switch (checkpoint incomplete) wait event. The conventional wisdom might direct you to immediately start trying solutions, like increasing redolog sizes in a trial-and-error manner, but let’s drill deeper first. Understand first, then fix.
Since the log file switch waits mean that your sessions are directly waiting for LGWR, let’s see what LGWR itself is doing, by running snapper for 30 seconds on LGWR:
SQL> @snapper all 30 1 lgwr
Sampling SID lgwr with interval 30 seconds, taking 1 snapshots...

-- Session Snapper v4.26 - by Tanel Poder ( https://tanelpoder.com/snapper ) - Enjoy the Most Advanced Oracle Troubleshooting Script on the Planet! :)

----------------------------------------------------------------------------------------------------------------------------------------------------------------------------------------------
    SID, USERNAME  , TYPE, STATISTIC                                                 ,         DELTA, HDELTA/SEC,    %TIME, GRAPH       , NUM_WAITS,  WAITS/SEC,   AVERAGES
----------------------------------------------------------------------------------------------------------------------------------------------------------------------------------------------
    250, (LGWR)    , STAT, non-idle wait time                                        ,           162,       5.26,         ,             ,          ,           ,          ~ per execution
    250, (LGWR)    , STAT, non-idle wait count                                       ,          5245,     170.28,         ,             ,          ,           ,          ~ per execution
    250, (LGWR)    , STAT, in call idle wait time                                    ,          2904,      94.28,         ,             ,          ,           ,          ~ per execution
    250, (LGWR)    , STAT, messages received                                         ,           606,      19.67,         ,             ,          ,           ,          ~ per execution
    250, (LGWR)    , STAT, background timeouts                                       ,            10,        .32,         ,             ,          ,           ,          ~ per execution
    250, (LGWR)    , STAT, enqueue requests                                          ,          1212,      39.35,         ,             ,          ,           ,          ~ per execution
    250, (LGWR)    , STAT, enqueue releases                                          ,          1212,      39.35,         ,             ,          ,           ,          ~ per execution
    250, (LGWR)    , STAT, physical read total IO requests                           ,          3636,     118.04,         ,             ,          ,           ,     16.38k bytes per request
    250, (LGWR)    , STAT, physical read total bytes                                 ,      59572224,      1.93M,         ,             ,          ,           ,          ~ per execution
    250, (LGWR)    , STAT, cell physical IO interconnect bytes                       ,      59572224,      1.93M,         ,             ,          ,           ,          ~ per execution
    250, (LGWR)    , STAT, total cf enq hold time                                    ,           830,      26.95,         ,             ,          ,           ,          ~ per execution
    250, (LGWR)    , STAT, total number of cf enq holders                            ,           606,      19.67,         ,             ,          ,           ,          ~ per execution
    250, (LGWR)    , STAT, calls to kcmgcs                                           ,             1,        .03,         ,             ,          ,           ,          ~ per execution
    250, (LGWR)    , STAT, calls to kcmgas                                           ,            10,        .32,         ,             ,          ,           ,          ~ per execution
    250, (LGWR)    , STAT, OS User time used                                         ,            23,        .75,         ,             ,          ,           ,          ~ per execution
    250, (LGWR)    , STAT, OS System time used                                       ,            73,       2.37,         ,             ,          ,           ,          ~ per execution
    250, (LGWR)    , STAT, OS Block input operations                                 ,        193476,      6.28k,         ,             ,          ,           ,          ~ per execution
    250, (LGWR)    , STAT, OS Block output operations                                ,           666,      21.62,         ,             ,          ,           ,          ~ per execution
    250, (LGWR)    , STAT, OS Voluntary context switches                             ,          9024,     292.96,         ,             ,          ,           ,          ~ per execution
    250, (LGWR)    , STAT, OS Involuntary context switches                           ,            29,        .94,         ,             ,          ,           ,          ~ per execution
    250, (LGWR)    , TIME, background cpu time                                       ,        585124,       19ms,     1.9%, [#         ],          ,           ,
    250, (LGWR)    , TIME, background elapsed time                                   ,       1784456,    57.93ms,     5.8%, [#         ],          ,           ,       -.31 % unaccounted time
>>> 250, (LGWR)    , WAIT, rdbms ipc message                                         ,      29112655,   945.12ms,    94.5%, [WWWWWWWWWW],       560,      18.18,    51.99ms average wait
    250, (LGWR)    , WAIT, control file sequential read                              ,       1510205,    49.03ms,     4.9%, [W         ],      3660,     118.82,   412.62us average wait
    250, (LGWR)    , WAIT, events in waitclass Other                                 ,        117718,     3.82ms,      .4%, [          ],       610,       19.8,   192.98us average wait

    376, (LG00)    , STAT, in call idle wait time                                    ,          3075,      99.83,         ,             ,          ,           ,          ~ per execution
    376, (LG00)    , STAT, OS User time used                                         ,             4,        .13,         ,             ,          ,           ,          ~ per execution
    376, (LG00)    , STAT, OS System time used                                       ,            12,        .39,         ,             ,          ,           ,          ~ per execution
    376, (LG00)    , STAT, OS Block output operations                                ,          9586,      311.2,         ,             ,          ,           ,          ~ per execution
    376, (LG00)    , STAT, OS Voluntary context switches                             ,          2191,      71.13,         ,             ,          ,           ,          ~ per execution
    376, (LG00)    , STAT, OS Involuntary context switches                           ,            15,        .49,         ,             ,          ,           ,          ~ per execution
    376, (LG00)    , TIME, background cpu time                                       ,         43793,     1.42ms,      .1%, [          ],          ,           ,
    376, (LG00)    , TIME, background elapsed time                                   ,         19491,   632.76us,      .1%, [          ],          ,           ,       -.18 % unaccounted time
>>> 376, (LG00)    , WAIT, LGWR worker group idle                                    ,      30839468,         1s,   100.1%, [WWWWWWWWWW],       610,       19.8,    50.56ms average wait

    625, (LG01)    , STAT, in call idle wait time                                    ,          3074,       99.8,         ,             ,          ,           ,          ~ per execution
    625, (LG01)    , STAT, OS User time used                                         ,             4,        .13,         ,             ,          ,           ,          ~ per execution
    625, (LG01)    , STAT, OS System time used                                       ,             7,        .23,         ,             ,          ,           ,          ~ per execution
    625, (LG01)    , STAT, OS Block output operations                                ,          2308,      74.93,         ,             ,          ,           ,          ~ per execution
    625, (LG01)    , STAT, OS Voluntary context switches                             ,          1889,      61.33,         ,             ,          ,           ,          ~ per execution
    625, (LG01)    , STAT, OS Involuntary context switches                           ,             5,        .16,         ,             ,          ,           ,          ~ per execution
    625, (LG01)    , TIME, background cpu time                                       ,         31669,     1.03ms,      .1%, [          ],          ,           ,
    625, (LG01)    , TIME, background elapsed time                                   ,         11492,   373.08us,      .0%, [          ],          ,           ,       -.18 % unaccounted time
>>> 625, (LG01)    , WAIT, LGWR worker group idle                                    ,      30847424,         1s,   100.1%, [WWWWWWWWWW],       610,       19.8,    50.57ms average wait

--  End of Stats snap 1, end=2018-10-06 00:18:07, seconds=30.8


---------------------------------------------------------------------------------------------------------------
  ActSes   %Thread | INST | SQL_ID          | SQL_CHILD | EVENT                               | WAIT_CLASS
---------------------------------------------------------------------------------------------------------------
     .06      (6%) |    1 |                 | 0         | control file sequential read        | System I/O
     .02      (2%) |    1 |                 | 0         | LGWR all worker groups              | Other

--  End of ASH snap 1, end=2018-10-06 00:18:07, seconds=30, samples_taken=99, AAS=.1
Sorry for the lengthy output, but this is what the LGWR processes report! It looks like we are using 2 LGWR slaves (12c new feature) in addition to the log writer itself (LGWR, LG00, LG01). LGWR slaves are enabled by default in Oracle 12c and later, but their use is adaptive - LGWR decides to delegate work to the slaves or do all work itself depending on the workload.
But what we see here is that LGWR seems to be quite inactive! The Snapper “ASH” section in the bottom only shows about 0.06+0.02 active sessions during the last 30 seconds. The LGWR worker group idle and rdbms ipc message wait events (wait for wake-up post/call from other processes) show that LGWR is close to 95% idle.
That’s weird as you’d think that whenever your database is stuck waiting for the log file switch (checkpoint incomplete) wait event, then the LGWR must be really busy doing work (CPU or IO) or at least would be waiting for some other wait event to finish. But it shows it’s just chilling out being idle most of the time.
The bigger picture
Let’s see the bigger picture from another angle:
SQL> @ash/ash_wait_chains program2||event2 1=1 sysdate-1/24/12 sysdate

-- Display ASH Wait Chain Signatures script v0.4 BETA by Tanel Poder ( https://tanelpoder.com )

%This     SECONDS     AAS WAIT_CHAIN
------ ---------- ------- -------------------------------------------------------------------------------------------------------------------------------------------------------------------------
  39%        1665     5.6 -> (JDBC Thin Client) log file switch (checkpoint incomplete)  -> [idle blocker 1,250,30651 (oracle@oel7.localdomain (LGWR))]
  21%         910     3.0 -> (JDBC Thin Client) log file switch (checkpoint incomplete)  -> (LGWR) enq: CF - contention  -> (CKPT) direct path write
   7%         283      .9 -> (DBWn) db file parallel write
   5%         203      .7 -> (PSPn) ON CPU
   5%         201      .7 -> (JDBC Thin Client) db file sequential read
   4%         166      .6 -> (Jnnn) log file switch (checkpoint incomplete)  -> [idle blocker 1,250,30651 (oracle@oel7.localdomain (LGWR))]
   2%          91      .3 -> (LGWR) enq: CF - contention  -> (CKPT) direct path write
   2%          91      .3 -> (Jnnn) log file switch (checkpoint incomplete)  -> (LGWR) enq: CF - contention  -> (CKPT) direct path write
   2%          91      .3 -> (CKPT) direct path write
   2%          80      .3 -> (oracle) log file switch (checkpoint incomplete)  -> (LGWR) enq: CF - contention  -> (CKPT) direct path write
   2%          80      .3 -> (JDBC Thin Client) log file switch (checkpoint incomplete)  -> (LGWR) LGWR all worker groups  -> [idle blocker 1,376,1907 (oracle@oel7.localdomain (LG00))]
   1%          55      .2 -> (SMON) buffer busy waits [undo @bclass 23]  -> (JDBC Thin Client) log file switch (checkpoint incomplete)  -> (LGWR) enq: CF - contention  -> (CKPT) direct path write
   1%          43      .1 -> (MMON) log file switch (checkpoint incomplete)  -> [idle blocker 1,250,30651 (oracle@oel7.localdomain (LGWR))]
   1%          41      .1 -> (MMON) enq: CF - contention  -> (CKPT) direct path write
   1%          40      .1 -> (Wnnn) buffer busy waits [undo @bclass 23]  -> (JDBC Thin Client) log file switch (checkpoint incomplete)  -> (LGWR) enq: CF - contention  -> (CKPT) direct path write
   1%          40      .1 -> (JDBC Thin Client) log file switch (checkpoint incomplete)  -> (LGWR) control file sequential read
 ...
When you look at the first line of output and scroll right in the above text-box (and know how to read ash_wait_chains signatures - youtube videos are here part1 & part2), you’ll see that despite the database having log file switch (checkpoint incomplete) wait as the top level symptom, 39% time in the last 5 minutes was spent ultimately waiting for LGWR - who itself happened to be idle (when ASH samples were taken). That is weird as we’d expect LGWR to be really busy doing stuff when everyone else is waiting for it to complete the log switch.
The 2nd line above shows that 21% of DB time was spent on a chain of waiters who waited for LGWR to complete the log file switch, who in turn was waiting (not idle) for the CKPT process to complete a direct path write somewhere.
So we have two questions here:
- How come is the LGWR process mostly idle when everyone’s waiting for it?
- Why is the CKPT process with its direct path write wait event also a significant ultimate blocker?
LGWR activity
Let’s look into the LGWR data again. I have highlighted the interesting lines with “»>”:
----------------------------------------------------------------------------------------------------------------------------------------------------------------------------------------------
    SID, USERNAME  , TYPE, STATISTIC                                                 ,         DELTA, HDELTA/SEC,    %TIME, GRAPH       , NUM_WAITS,  WAITS/SEC,   AVERAGES
----------------------------------------------------------------------------------------------------------------------------------------------------------------------------------------------
    250, (LGWR)    , STAT, non-idle wait time                                        ,           162,       5.26,         ,             ,          ,           ,          ~ per execution
    250, (LGWR)    , STAT, non-idle wait count                                       ,          5245,     170.28,         ,             ,          ,           ,          ~ per execution
    250, (LGWR)    , STAT, in call idle wait time                                    ,          2904,      94.28,         ,             ,          ,           ,          ~ per execution
    250, (LGWR)    , STAT, messages received                                         ,           606,      19.67,         ,             ,          ,           ,          ~ per execution
    250, (LGWR)    , STAT, background timeouts                                       ,            10,        .32,         ,             ,          ,           ,          ~ per execution
    250, (LGWR)    , STAT, enqueue requests                                          ,          1212,      39.35,         ,             ,          ,           ,          ~ per execution
    250, (LGWR)    , STAT, enqueue releases                                          ,          1212,      39.35,         ,             ,          ,           ,          ~ per execution
>>> 250, (LGWR)    , STAT, physical read total IO requests                           ,          3636,     118.04,         ,             ,          ,           ,     16.38k bytes per request
    250, (LGWR)    , STAT, physical read total bytes                                 ,      59572224,      1.93M,         ,             ,          ,           ,          ~ per execution
    250, (LGWR)    , STAT, cell physical IO interconnect bytes                       ,      59572224,      1.93M,         ,             ,          ,           ,          ~ per execution
    250, (LGWR)    , STAT, total cf enq hold time                                    ,           830,      26.95,         ,             ,          ,           ,          ~ per execution
    250, (LGWR)    , STAT, total number of cf enq holders                            ,           606,      19.67,         ,             ,          ,           ,          ~ per execution
    250, (LGWR)    , STAT, calls to kcmgcs                                           ,             1,        .03,         ,             ,          ,           ,          ~ per execution
    250, (LGWR)    , STAT, calls to kcmgas                                           ,            10,        .32,         ,             ,          ,           ,          ~ per execution
    250, (LGWR)    , STAT, OS User time used                                         ,            23,        .75,         ,             ,          ,           ,          ~ per execution
    250, (LGWR)    , STAT, OS System time used                                       ,            73,       2.37,         ,             ,          ,           ,          ~ per execution
    250, (LGWR)    , STAT, OS Block input operations                                 ,        193476,      6.28k,         ,             ,          ,           ,          ~ per execution
    250, (LGWR)    , STAT, OS Block output operations                                ,           666,      21.62,         ,             ,          ,           ,          ~ per execution
    250, (LGWR)    , STAT, OS Voluntary context switches                             ,          9024,     292.96,         ,             ,          ,           ,          ~ per execution
    250, (LGWR)    , STAT, OS Involuntary context switches                           ,            29,        .94,         ,             ,          ,           ,          ~ per execution
    250, (LGWR)    , TIME, background cpu time                                       ,        585124,       19ms,     1.9%, [#         ],          ,           ,
    250, (LGWR)    , TIME, background elapsed time                                   ,       1784456,    57.93ms,     5.8%, [#         ],          ,           ,       -.31 % unaccounted time
>>> 250, (LGWR)    , WAIT, rdbms ipc message                                         ,      29112655,   945.12ms,    94.5%, [WWWWWWWWWW],       560,      18.18,    51.99ms average wait
>>> 250, (LGWR)    , WAIT, control file sequential read                              ,       1510205,    49.03ms,     4.9%, [W         ],      3660,     118.82,   412.62us average wait
    250, (LGWR)    , WAIT, events in waitclass Other                                 ,        117718,     3.82ms,      .4%, [          ],       610,       19.8,   192.98us average wait
Looks like LGWR also performs quite a few control file sequential reads right now. The “waits/sec” column shows 118 control file reads per second! Given that the reads are pretty fast (412us on average), this wait event takes under 5% of LGWR time, LGWR is idle for most of the remaining time as the rdbms ipc message idle wait events show.
So, why would LGWR be mostly idle as far as the wait events show, while many sessions wait for it and yet sample the controlfile contents so frequently? There must be a reason. Perhaps the LGWR is waiting for something to “show up” in the controlfile and it’s just waiting in a loop, going voluntarily to idle sleep for a bit whenever that condition hasn’t been met?
Normally I would follow the blocking_session columns (just like the ash_wait_chains.sql script does) to understand the wait topology, but again, LGWR is mostly idle, not actively waiting for anything as far as the wait event shows. So we need alternative, perhaps somewhat indirect evidence to give us hints what the LGWR could be internally waiting for.
What are we really waiting for?
So let’s take a step back and think about what the log file switch (checkpoint incomplete) wait event really is about. As the current online redo log is full, LGWR is trying to reuse the next online redolog file. However, after examining the DBWR/checkpoint writing progress, it realizes that not all dirty buffers that are protected by the redo in that next logfile (that would get overwritten) have been written to disk yet. So, in order to guarantee durability of the data, LGWR has to wait with its log switch until DBWR has completed writing the relevant dirty buffers to disk.
So, this log file switch (checkpoint incomplete) wait is not really a LGWR bottleneck, it’s DBWR bottleneck!
We can not proceed until DBWR has completed the writes to disk, so we need to see what DBWR is doing and why is it falling behind. As most of the internet searches would tell you, you could try to add more redolog files or use bigger redologs, but if DBWR consistently falls behind, then even with huge redologs you’d eventually hit this problem. So, better to fix the cause (DBWR writes falling behind) and not the symptom (the log file switch wait event).
So, why does DBWR fall behind when writing dirty buffers to disk? The most likely suspect is just slow IO subsystem. Perhaps you’ve overloaded your storage array or some other system you are sharing this storage array with is doing that. Or there’s a configuration problem somewhere (hint: you need concurrent write capable async I/O). Or one of the disks in the RAID-5 system has failed and the storage array just can’t cope with all the extra IO. Or your storage hardware just does not have enough IO capacity for the amount of processing you’re trying to do.
So let’s see what DBWR is doing then:
Sampling SID dbwr with interval 5 seconds, taking 1 snapshots...

-- Session Snapper v4.26 - by Tanel Poder ( https://tanelpoder.com/snapper ) - Enjoy the Most Advanced Oracle Troubleshooting Script on the Planet! :)

---------------------------------------------------------------------------------------------------------------------------------------------------------------------------------------------------------------
    SID, USERNAME  , TYPE, STATISTIC                                                 ,         DELTA, HDELTA/SEC,    %TIME, GRAPH       , NUM_WAITS,  WAITS/SEC,   AVERAGES
---------------------------------------------------------------------------------------------------------------------------------------------------------------------------------------------------------------
    127, (DBW0)    , STAT, non-idle wait time                                        ,           929,     195.08,         ,             ,          ,           ,          ~ per execution
    127, (DBW0)    , STAT, non-idle wait count                                       ,             4,        .84,         ,             ,          ,           ,          ~ per execution
    127, (DBW0)    , STAT, messages received                                         ,             2,        .42,         ,             ,          ,           ,          ~ per execution
    127, (DBW0)    , STAT, enqueue requests                                          ,             1,        .21,         ,             ,          ,           ,          ~ per execution
    127, (DBW0)    , STAT, enqueue releases                                          ,             1,        .21,         ,             ,          ,           ,          ~ per execution
>>> 127, (DBW0)    , STAT, physical write total IO requests                          ,           465,      97.64,         ,             ,          ,           ,     10.98k bytes per request
    127, (DBW0)    , STAT, physical write total multi block requests                 ,             4,        .84,         ,             ,          ,           ,        461 total single block write requests
    127, (DBW0)    , STAT, physical write total bytes                                ,       5103616,      1.07M,         ,             ,          ,           ,          ~ per execution
    127, (DBW0)    , STAT, cell physical IO interconnect bytes                       ,       5103616,      1.07M,         ,             ,          ,           ,          ~ per execution
    127, (DBW0)    , STAT, physical writes                                           ,           624,     131.03,         ,             ,          ,           ,          ~ per execution
    127, (DBW0)    , STAT, physical writes from cache                                ,           624,     131.03,         ,             ,          ,           ,          ~ per execution
    127, (DBW0)    , STAT, physical write IO requests                                ,           483,     101.42,         ,             ,          ,           ,     10.58k bytes per request
    127, (DBW0)    , STAT, physical write bytes                                      ,       5111808,      1.07M,         ,             ,          ,           ,          ~ per execution
    127, (DBW0)    , STAT, physical writes non checkpoint                            ,           489,     102.68,         ,             ,          ,           ,          ~ per execution
    127, (DBW0)    , STAT, summed dirty queue length                                 ,          1226,     257.44,         ,             ,          ,           ,          ~ per execution
    127, (DBW0)    , STAT, DBWR checkpoint buffers written                           ,           356,      74.76,         ,             ,          ,           ,          ~ per execution
    127, (DBW0)    , STAT, DBWR undo block writes                                    ,            41,       8.61,         ,             ,          ,           ,          ~ per execution
    127, (DBW0)    , STAT, DBWR revisited being-written buffer                       ,             3,        .63,         ,             ,          ,           ,          ~ per execution
    127, (DBW0)    , STAT, redo entries                                              ,             1,        .21,         ,             ,          ,           ,          ~ per execution
    127, (DBW0)    , STAT, redo size                                                 ,          5104,      1.07k,         ,             ,          ,           ,          ~ bytes per user commit
    127, (DBW0)    , STAT, file io wait time                                         ,    2716590765,    570.45M,         ,             ,          ,           ,      5.84s bad guess of IO wait time per IO request
    127, (DBW0)    , TIME, background cpu time                                       ,          5284,     1.11ms,      .1%, [          ],          ,           ,
    127, (DBW0)    , TIME, background elapsed time                                   ,       4706760,   988.36ms,    98.8%, [##########],          ,           ,       1.16 % unaccounted time
>>> 127, (DBW0)    , WAIT, db file parallel write                                    ,       4704199,   987.82ms,    98.8%, [WWWWWWWWWW],         1,        .21,       4.7s average wait <<<
    127, (DBW0)    , WAIT, db file async I/O submit                                  ,           229,    48.09us,      .0%, [          ],         1,        .21,      229us average wait

--  End of Stats snap 1, end=2018-10-05 20:06:34, seconds=4.8


---------------------------------------------------------------------------------------------------------------
  ActSes   %Thread | INST | SQL_ID          | SQL_CHILD | EVENT                               | WAIT_CLASS
---------------------------------------------------------------------------------------------------------------
>>> 1.00    (100%) |    1 |                 | 0         | db file parallel write              | System I/O

--  End of ASH snap 1, end=2018-10-05 20:06:34, seconds=5, samples_taken=39, AAS=1
From the wait event section in the bottom, it’s pretty clear that DBWR is overloaded or at least at its full capacity. With asynchronous I/O these percentages don’t always have a simple “linear” meaning, but nevertheless DBWR is 100% busy waiting for IO request completion as the db file parallel write wait event shows. Also there’s no idle rdbms ipc reply wait event time reported at all. DBWR has managed to issue about 97 write requests per second as the physical write total IO requests metric shows. And the average wait for the db file parallel write (usually I/O reaping wait event when async IO is enabled and you don’t hit a bug) is 4.7 seconds. As this is an asynchronous IO wait event, this doesn’t mean that a single I/O took that long, but rather waiting for completion of a whole batch of asynchronously submitted I/Os.
Additional wait interface fun:
The original database where this happened was on Solaris SPARC and Oracle has a wait event shortcoming on that platform that causes V$SESSION (and therefore ASH or Snapper’s “ash” section) to incorrectly report DBWR as 100% on CPU. But at the same time the TIME model metric background cpu time that is read from the OS showed very low actual CPU usage and the OS level top command confirmed that, indicating that the majority of DBWR time was spent in uninstrumented system calls (for DBWR, typically the ones that should be reported as db file parallel write or db file async I/O submit)
So, this indicates an I/O issue - DBWR can not keep up as the storage subsystem, in whichever layer the bottleneck is, does not complete the write I/Os fast enough. So, instead of playing with redo log file sizes, assuming that you don’t have unreasonably small redologs, it’s time to fix the I/O bottleneck that is slowing DBWR down (or just do less I/O :-).
What about the CKPT and the direct path write wait events?
The ash_wait_chains.sql output above also captured a wait topology (the 21% line below) where application sessions are waiting for LGWR, the LGWR itself is waiting for CKPT (as the latter is holding the controlfile enqueue) and while holding the CF enqueue, CKPT itself is waiting for completion of a direct path write that it has issued against some datafile:
%This     SECONDS     AAS WAIT_CHAIN
------ ---------- ------- -------------------------------------------------------------------------------------------------------------------------------------------------------------------------
  39%        1665     5.6 -> (JDBC Thin Client) log file switch (checkpoint incomplete)  -> [idle blocker 1,250,30651 (oracle@oel7.localdomain (LGWR))]
  21%         910     3.0 -> (JDBC Thin Client) log file switch (checkpoint incomplete)  -> (LGWR) enq: CF - contention  -> (CKPT) direct path write
...
This signature did not show up in the original system investigated, but looks like in my test database (Oracle 18.3 vs Oracle 12.2.0.1) the LGWR instrumentation is somewhat better. Or I just hit a slightly different timing or variation of this problem. So again in this case I’d need to see what the ultimate blocker (CKPT) is doing - as once I fix the CKPT direct path write bottleneck, LGWR won’t have to wait for CKPT that much anymore.
I ran both Snapper and ashtop on CKPT:
SQL> @snapper all 5 1 ckpt

Sampling SID 252 with interval 5 seconds, taking 1 snapshots...

-- Session Snapper v4.26 - by Tanel Poder ( https://tanelpoder.com/snapper ) - Enjoy the Most Advanced Oracle Troubleshooting Script on the Planet! :)

---------------------------------------------------------------------------------------------------------------------------------------------------------------------------------------------------------------
    SID, USERNAME  , TYPE, STATISTIC                                                 ,         DELTA, HDELTA/SEC,    %TIME, GRAPH       , NUM_WAITS,  WAITS/SEC,   AVERAGES
---------------------------------------------------------------------------------------------------------------------------------------------------------------------------------------------------------------
    252, (CKPT)    , WAIT, direct path write                                         ,       5000000,   960.92ms,    96.1%, [WWWWWWWWWW],         0,          0,         5s average wait

--  End of Stats snap 1, end=2018-10-06 00:26:50, seconds=5.2


---------------------------------------------------------------------------------------------------------------
  ActSes   %Thread | INST | SQL_ID          | SQL_CHILD | EVENT                               | WAIT_CLASS
---------------------------------------------------------------------------------------------------------------
    1.00    (100%) |    1 |                 | 0         | direct path write                   | User I/O

--  End of ASH snap 1, end=2018-10-06 00:26:50, seconds=5, samples_taken=47, AAS=1
Wow, CKPT is pretty much hung waiting for the single direct path write wait event to complete! When you scroll right, you see that the NUM_WAITS is 0 - so during this 5 second snapper run CKPT was stuck waiting for a single direct path write event (as opposed to completing lots of quick writes). So this definitely looks like a write I/O problem.
Now, why would CKPT do direct path writes into this database’s datafiles? Controlfile writes have their own control file parallel write wait events, so would not show up as direct path write wait events. It’s likely due to CKPT updating checkpoint progress in datafile headers. Normally, the incremental checkpoint progress that gets persisted every 3 seconds is written into controlfiles, but right now we are dealing with a log switch, so it looks like the CKPT process updates the datafile headers during the log switch, at the request of LGWR (it’s likely the v$datafile_header.checkpoint_change# field that needs to get updated).
Let’s confirm the location where the direct writes are done using ashtop.sql (I could also do this with Snapper using the ash= syntax):
SQL> @ashtop program2,event2,p1text,p1,p2text,p2 session_id=252 sysdate-1/24/12 sysdate

    Total
  Seconds     AAS %This   PROGRAM2                                 EVENT2                                     P1TEXT                                 P1 P2TEXT                                 P2
--------- ------- ------- ---------------------------------------- ------------------------------------------ ------------------------------ ---------- ------------------------------ ----------
       88      .3   97% | (CKPT)                                   direct path write                          file number                             3 first dba                               1
        2      .0    2% | (CKPT)                                   ON CPU                                     timeout                               300                                         0
        1      .0    1% | (CKPT)                                   control file parallel write                files                                   1 block#                                 24
The output above confirms that the direct path writes are done to a datafile header block - scroll right and check the direct path write wait events P2: the “first dba” = 1.
So, the CKPT process is also suffering from a really bad, slow write I/O problem when it tries to update datafile headers during a log switch. But at least in this case the wait interface was instrumented well enough that ash_wait_chains.sql could report the real ultimate blocker automatically.
The “fix”
Fixing I/O problems depends on your configuration and in which layer of the I/O subsystem the problem happens. One of the first things is to make sure that you’re using asynchronous I/O (disk_asynch_io must be true and you need to set filesystemio_options=setall if not running on ASM). Of course your physical hardware (storage array, SAN network path throughput between the host and the array) needs to be capable of handling the amount of IO you’re trying to do.
I had artificially created this datafile write I/O throughput problem with Linux cgroups in my lab environment, so I just disabled that hack and all the log file switch wait event symptoms went away.
DBWR was easily writing over 1500 buffers per second to disk and was barely busy:
---------------------------------------------------------------------------------------------------------------
  ActSes   %Thread | INST | SQL_ID          | SQL_CHILD | EVENT                               | WAIT_CLASS
---------------------------------------------------------------------------------------------------------------
     .08      (8%) |    1 |                 | 0         | db file async I/O submit            | System I/O
     .03      (3%) |    1 |                 | 0         | ON CPU                              | ON CPU
     .03      (3%) |    1 |                 | 0         | db file parallel write              | System I/O
Summary
The goal of this article was not to dive deep into I/O troubleshooting, but rather show the complex relationships between various Oracle processes. I showed how some I/O subsystem performance issues cause trouble for critical background processes at low level, but these issues may propagate up as different symptoms at higher level, especially when looking only into application foreground sessions.
Despite the OEM GUI and AWR reports showing log file switch (checkpoint incomplete) as the top level symptom, the actual root cause was an I/O performance problem that caused DBWR to fall behind writing dirty buffers to disk and in my case also CKPT who tried to write into datafile headers, but got stuck in lengthy I/O writes. And just one sluggish process (CKPT or DBWR) indirectly caused slowness and waits for many foreground sessions at the same time.
What made the troubleshooting harder, especially in the original customer environment, was that LGWR did not synchronously wait for the DBWR to make enough checkpointing progress and instead went voluntarily into an idle sleep and woke up to check the progress in a loop. That also explains the frequent control file sequential reads that LGWR was doing. There could be good reasons for not letting LGWR block in all cases (as it has other asynchronous & “timeout action” tasks it needs to do as well), but as a result, we didn’t see the full information of what LGWR really waited for from the wait interface.
Given this shortcoming of LGWR instrumentation, we then had to do some reasoning about Oracle fundamentals - how the instance communication & data processing architecture works and measure other processes known to be on the critical path of Oracle log switches. And indeed we saw DBWR being 100% busy waiting for datafile write IO completion and so was CKPT. Note that despite the wait event name, this problem had nothing to do with log file writing performance, I deliberately engineered this problem so that only datafile writes would be slow.
With systematic approach to troubleshooting, we avoided the trial and error changes that the typical Google or MOS search would advise you to try (“let’s just make redologs even bigger”) and found the real root cause of the problem faster.
Comments
I’m experimenting with using Twitter as the commenting system (let’s see if it works :-)
New blog: Troubleshooting log file switch (checkpoint incomplete) wait events and LGWR waiting for checkpoint progress.https://t.co/qeYv4zkGUK pic.twitter.com/SvijAdsoxY
— Tanel Poder 🇺🇦 (@TanelPoder) October 8, 2018