Update: I have uploaded the videos of this hacking session to YouTube.
I will run another hacking session that has been in my mind for a while. It will be a pretty narrow deep-dive into one of the SQL Monitoring report’s columns that is not well explained:
Oracle SQL Monitoring - Understanding the Execution Timeline column
In this hacking session, I will explain how to read the “Execution Timeline” column in the SQL Monitoring reports. There are some gotchas and things that look like inconsistencies to be aware of.
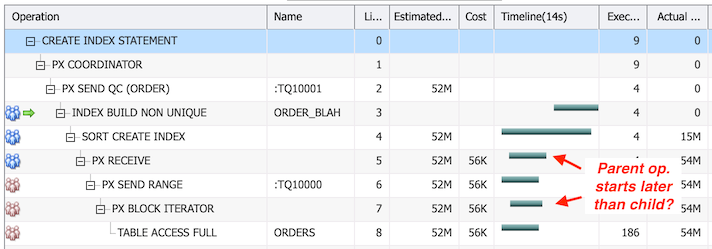
You’ll learn how to read this and why do there seem to be glitches in the row source start times in some cases:

As an additional bonus topic, I will show a few examples where SQL Monitoring numbers don’t always seem to make sense:
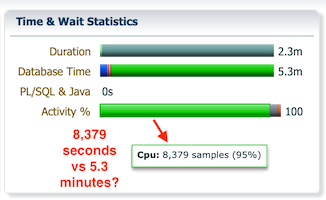
- The CPU time in the plan “Activity” section is reported much bigger than the CPU time in the report header
- Why the (serial) query Duration is shorter than DB Time reported in the SQL Monitoring report
CPU Activity vs CPU Usage in the SQL Monitor report header

What’s going on with this huge discrepancy?!
Serial query’s Duration less than DB Time?!

For parallel queries, a much shorter Duration (wall-clock time) than DB Time (total time all the PX slaves plus QC have spent actively doing work) is understandable. But sometimes you see Duration shorter than DB Time even for serial queries, what’s going on?!
Date & Time:
- Thursday 14 May 2020
- 12pm-1:30pm ET
Registration:
Preparation:
Thanks for signing up!
Note that this is a follow-up hacking session that goes deeper into more advanced topics of SQL Monitor reading and gotchas. Before attending this webinar, you should ideally review my earlier SQL Monitoring hacking session video:
- https://youtu.be/O5bwdUF0HMk (basic, prerequisite hacking session)
- https://youtu.be/jSvk0lxPjzY (optional, write consistency demo with SQL Monitoring)
“See” you soon!
