Last year I wrote an article about visualizing embedding vectors of a variety of different pictures as heatmaps. I used TorchVision with ImageNet1K_V1 model for encoding a bunch of different cat, dog and plane images into their embeddings, 1000 floating-point values in each resulting vector. I used the generate_embeddings.py script for that.
This whole exercise is just for my own learning (and fun), so it’s ok if there’s no other practical value coming from this work.
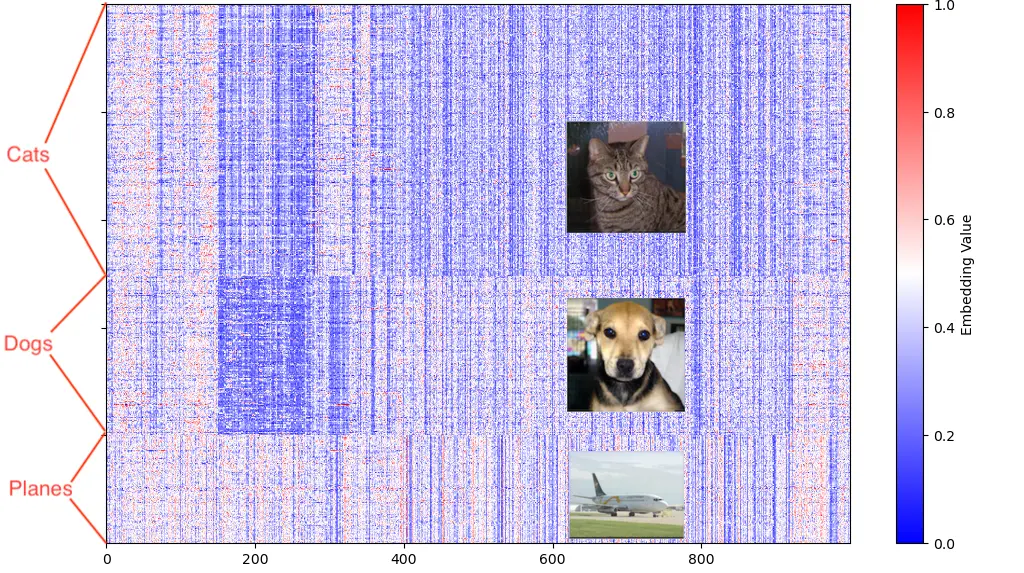
The heatmap of embeddings from about 250 different cats, 150 dogs and 100 planes is below:

Even though we can not make any far-reaching conclusions from eyeballing these low-level vector heatmaps, we do see that there are visible and differing patterns between each object type that the “AI” (ImageNet model inference) went through. All these images were of different cats, dogs and planes, yet they resulted in visible similarities in their resulting embedding vectors within their respective groups.
As a next step, I wanted to take the same (cat) image and create 360 copies of it, but rotate each copy by one more degree (from 0 degrees to 359 degrees). It’s still the same cat, but let’s see how our model handles it, as far as the output vectors are concerned.
Comparing rotated versions of the same photo
I just pushed the v0.2 update to my CatBench Vector Search Playground repo that you can try out yourself.
Now you have one more option to choose from:

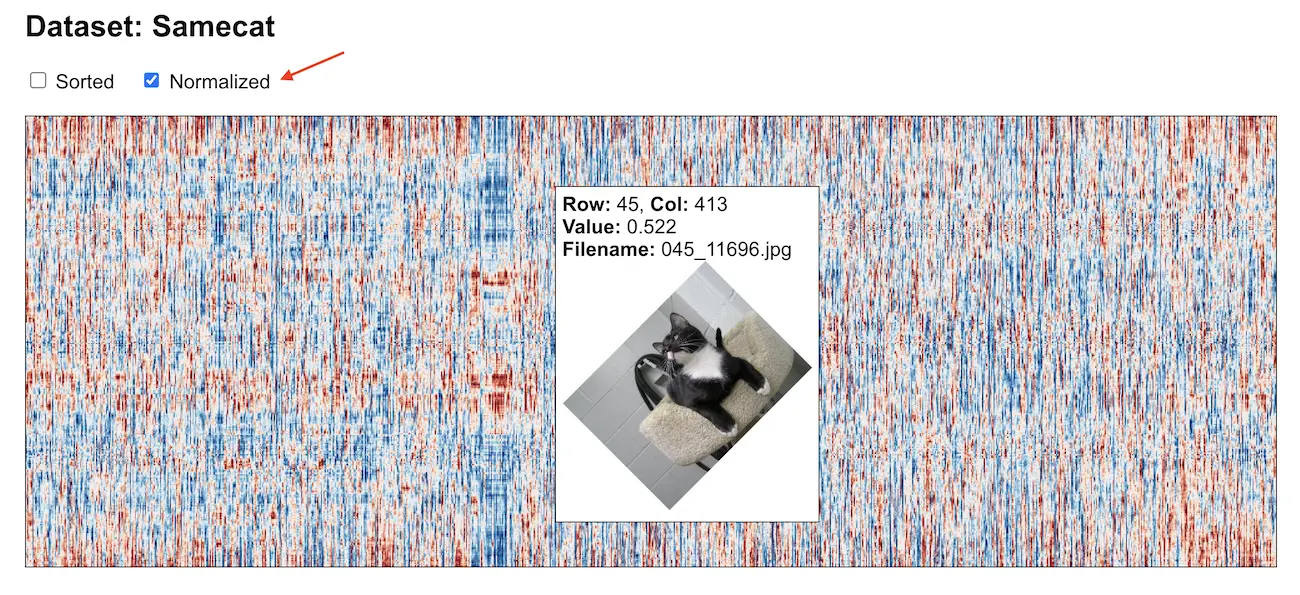
In the screenshot below, you see a matrix of 1000 x 360 pixels: 1000-element vectors of 360 rotated versions of the same cat photo. The heatmap looks pretty random and noisy, compared to the patterns seen in my previous blog post:

This is because my demo app defaults to the “Normalized” output, so that occasional outliers in any of the 1000 columns would not “overwhelm” the heat range of the visualization that would make you miss all the other subtler patterns. This is useful when comparing vectors of all the different objects (cats, dogs, planes) across the datasets where some images were intentionally outliers or abnormal.
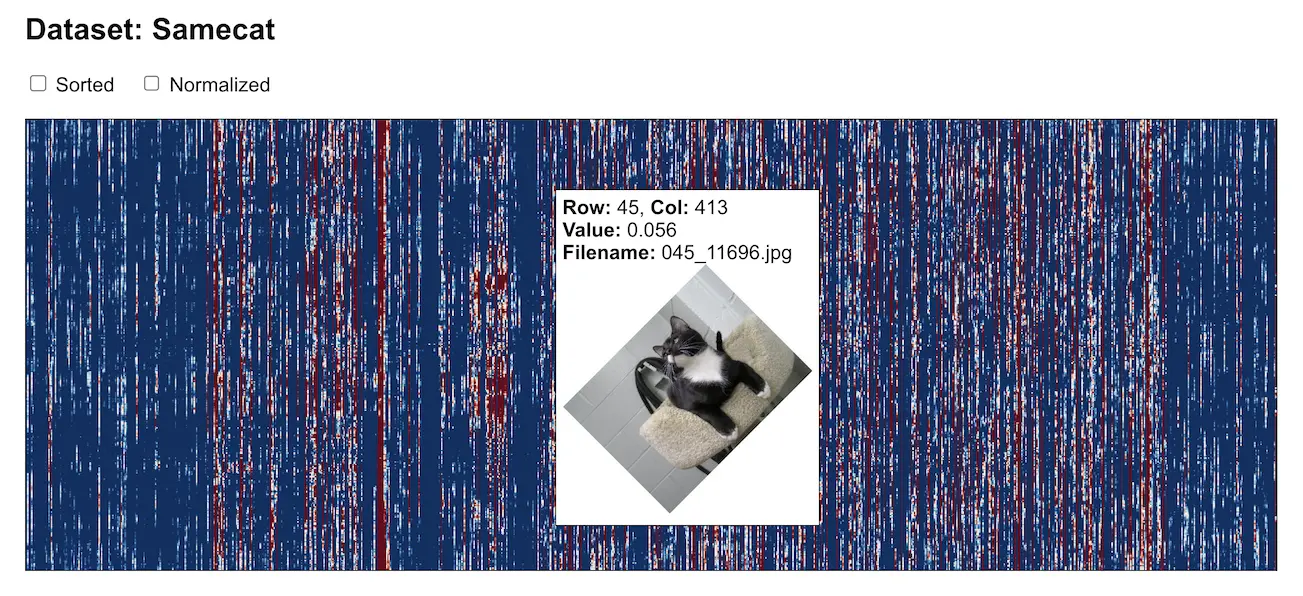
But for this exercise (of comparing the same cat pic), it’s better to disable the normalization, which you can do in the UI. This is what I did and in the screenshot below you see the heatmap of 360 vectors, all generated from a rotated variation of the same cat photo:

When visualizing the absolute values of all elements of each individual vector, some vertical patterns indeed emerge. After all, these embedding vectors were all derived from pretty much the same photo.
Summary
From this little experiment, you see that:
- This ImageNet model doesn’t care that much about the exact angle that a photo is taken from, it still finds enough similarities at higher levels of its “feature extraction” flow. That’s largely the whole point of AI of course, we are not comparing pixels bit by bit, but try to derive higher level shapes, relationships and meaning from the inputs (and then producing their embedding vectors). What this meaning actually means, depends on the model used and what kind of data it was trained on.
- As you see, the image detection of the same cat is not perfect, otherwise we’d also see perfect vertical lines in our heatmap. This is because the model was not trained to recognize this cat and only this cat, but had lots of other objects fed to it in its training dataset. Also, there’s a degree of randomness (stochasticity) and variability involved during the training process, depending on the training process architecture and setup. AI is a probability game.
I am now pretty far out of my area of expertise, so I’ll stop. Hopefully this article showed you at least something about the low-level nature of the vectors emitted by the “vision model” I used. As I said before, it is not possible to make any far-reaching conclusions just by eyeballing a single vector, but you sure can compare a bunch of them (for learning and fun) using a heatmap!
In the next part of this series, I put all this data into use with some Postgres-based vector similarity search examples! Later on I also ran similar tests on Google’s AlloyDB Omni Postgres compatible database (that post also links to other relevant articles I’ve written on this topic).
