CatBench is a Postgres + PgVector demo application that uses 25k pet photos from a Kaggle dataset for demonstrating how the similarity search features work together with the rest of your application code & schema in the backend (HammerDB Order Entry).
[Jump to the new stress test + monitoring section]
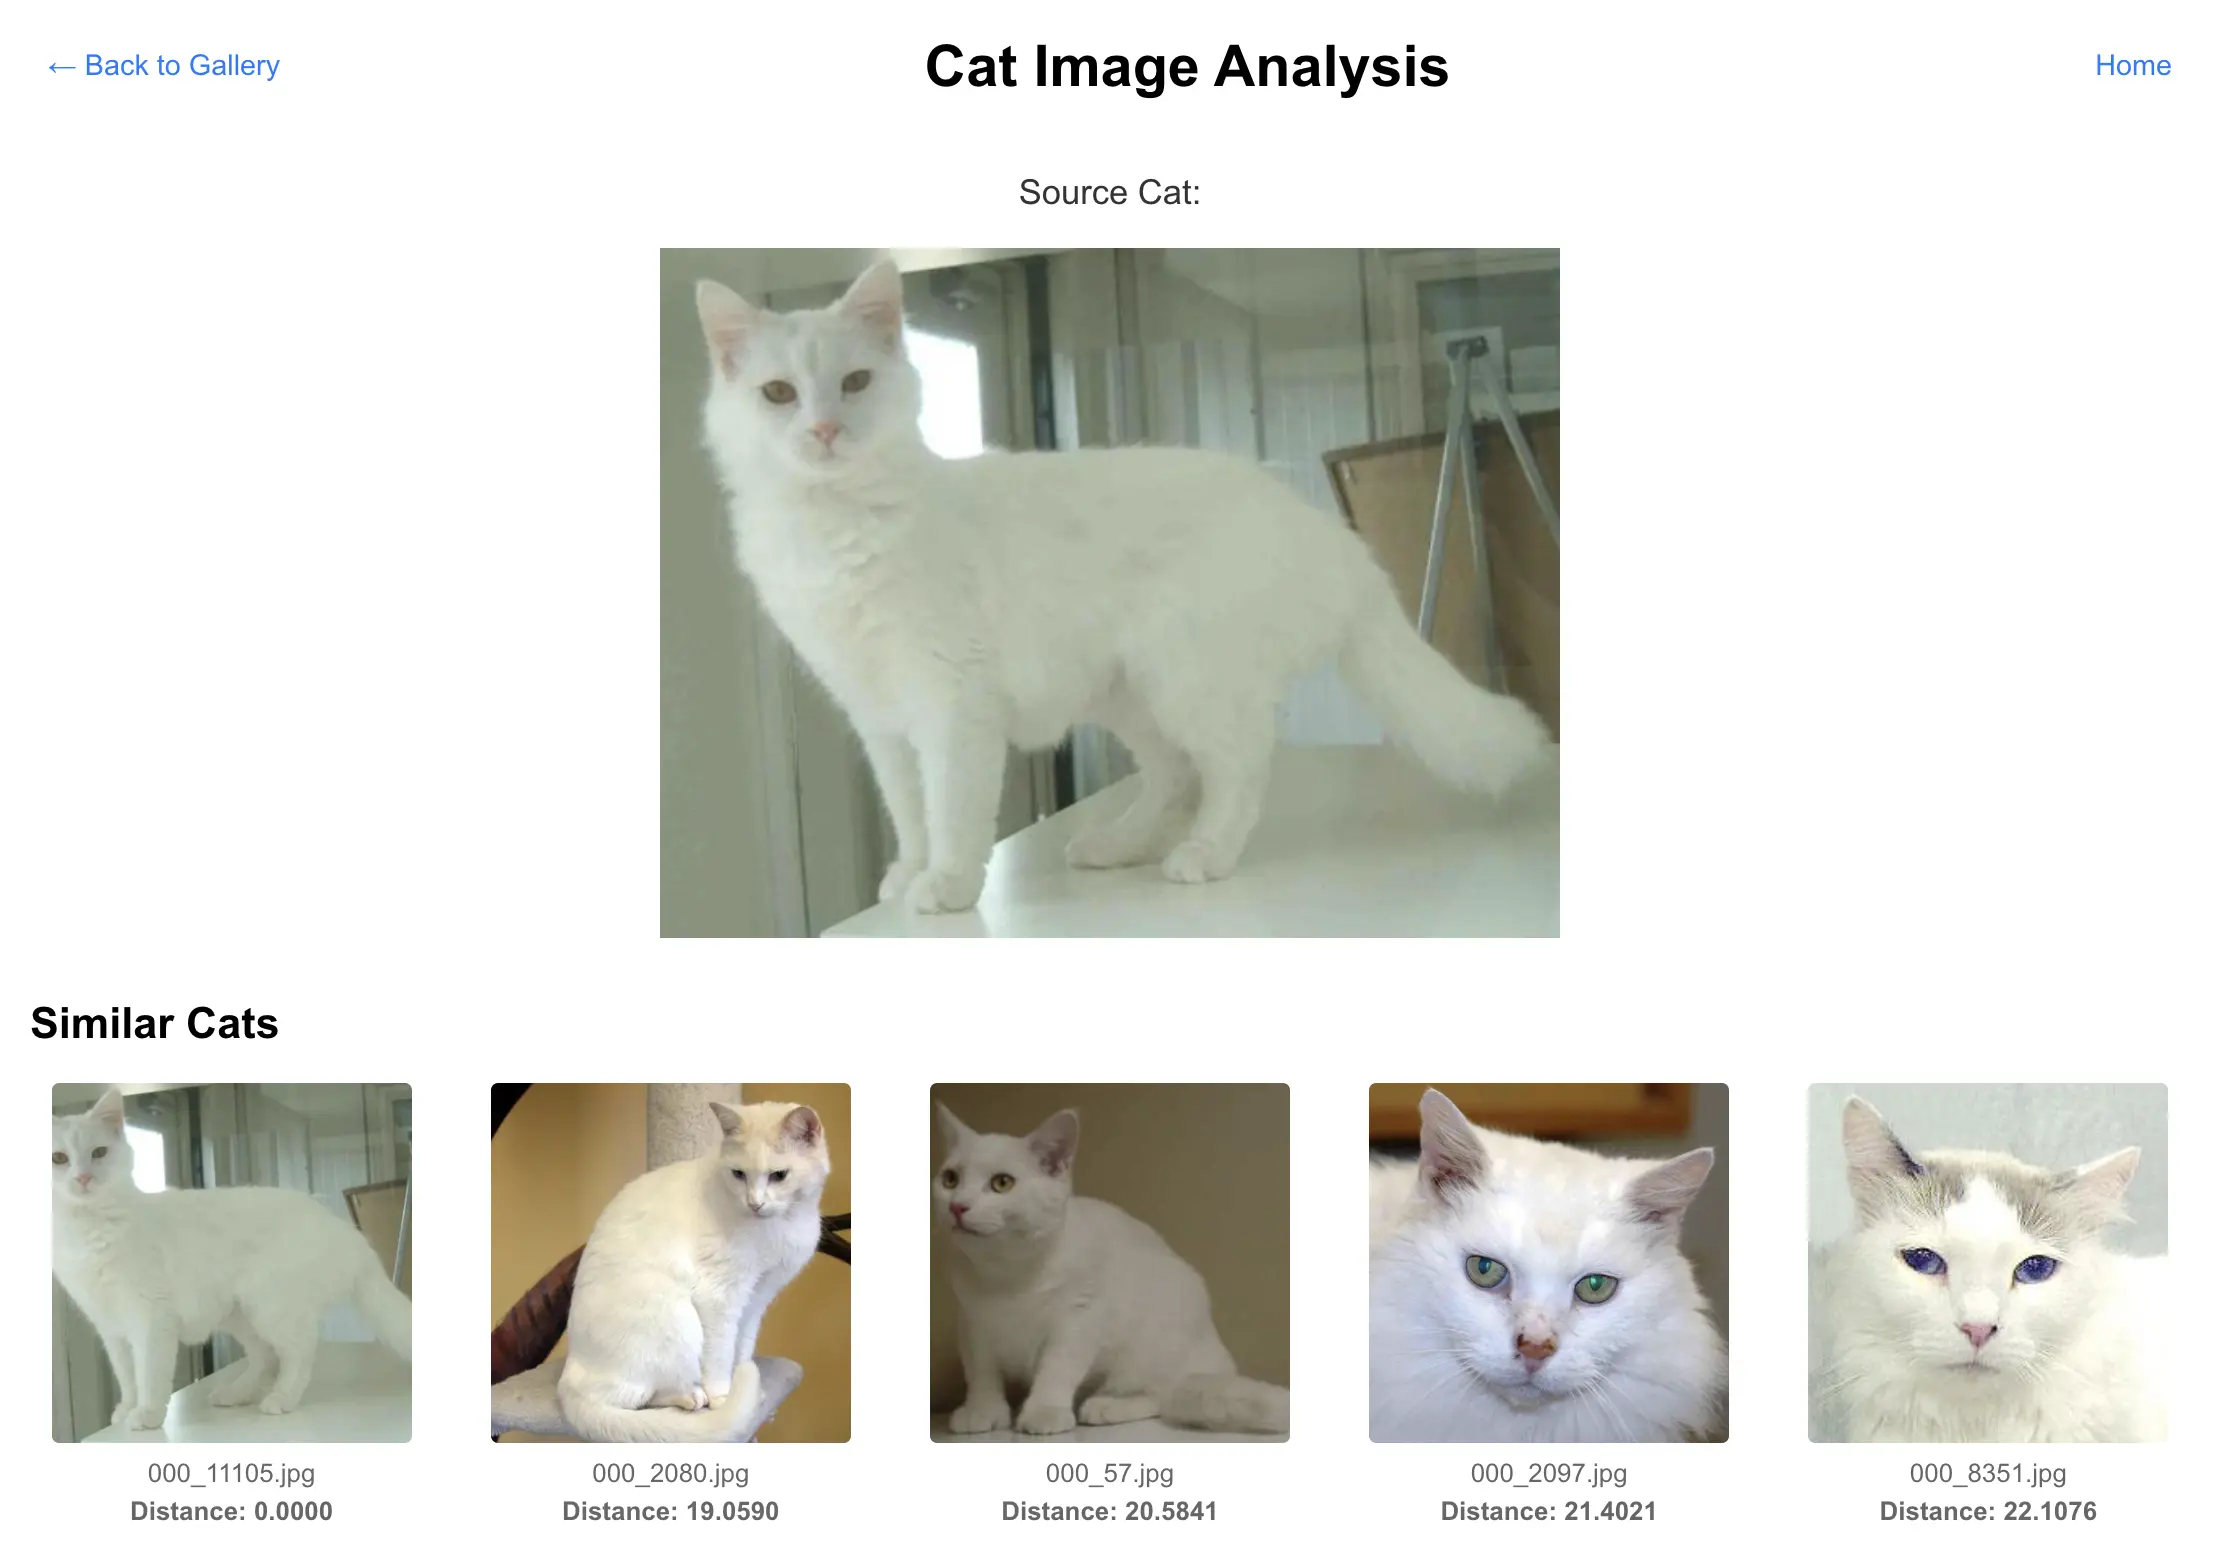
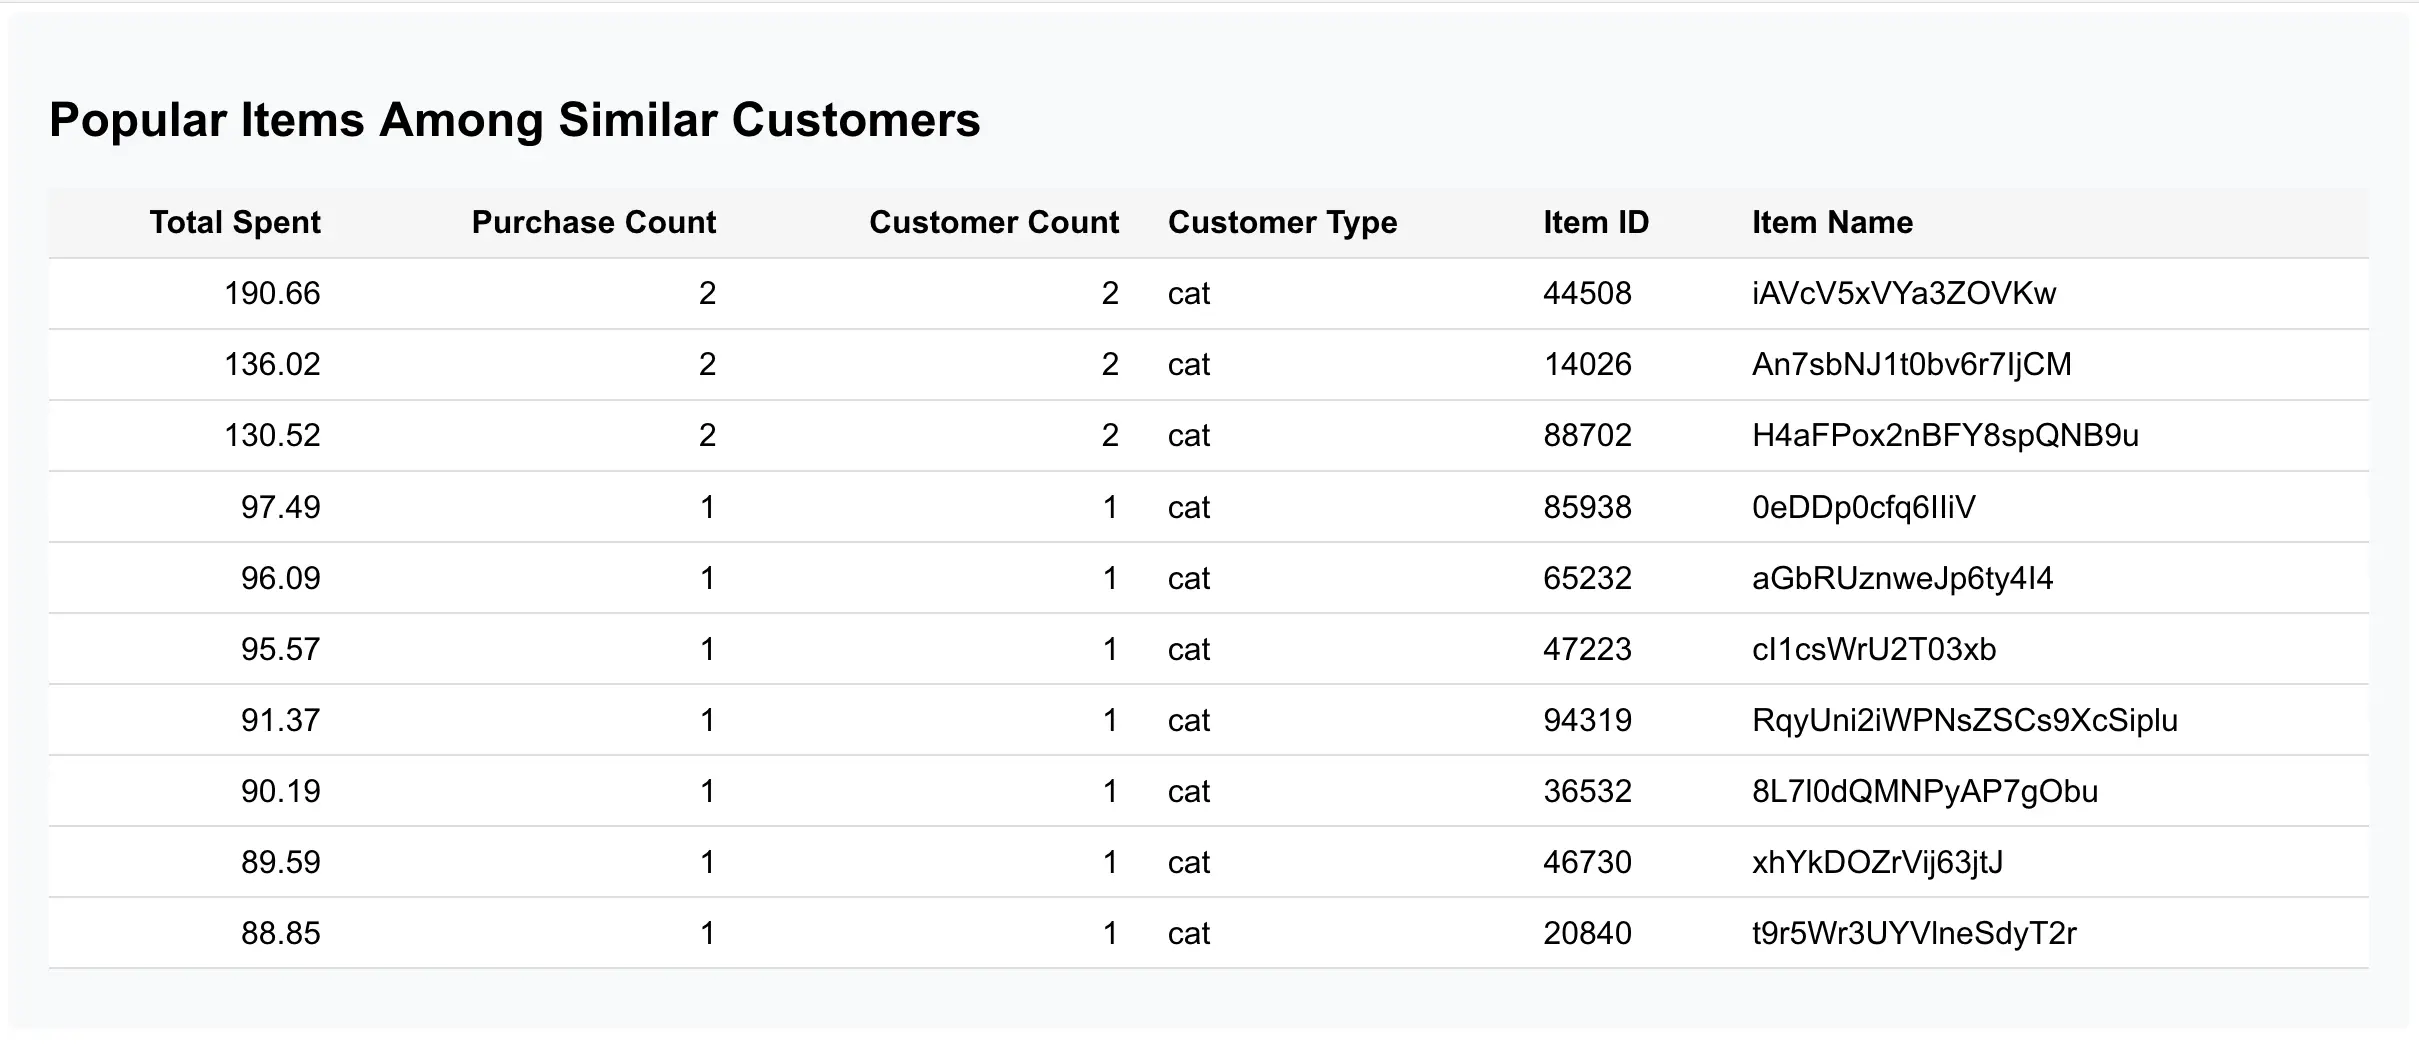
CatBench Interactive UI
You can navigate around the recommendation engine for Cat Purchases UI, click on cat photos and find product recommendations, based on what other similar-looking cats have purchased. This is where CatBench joins vector search results together with your regular application schema. When you scroll down, you see the backend SQL queries of your UI activity with their plan execution metrics (see below):
The app ran every backend query twice, first with EXPLAIN (ANZLYZE, BUFFERS), so that you’d see how many physical block I/Os these queries do - and the second run was to retrieve data to display in the UI.
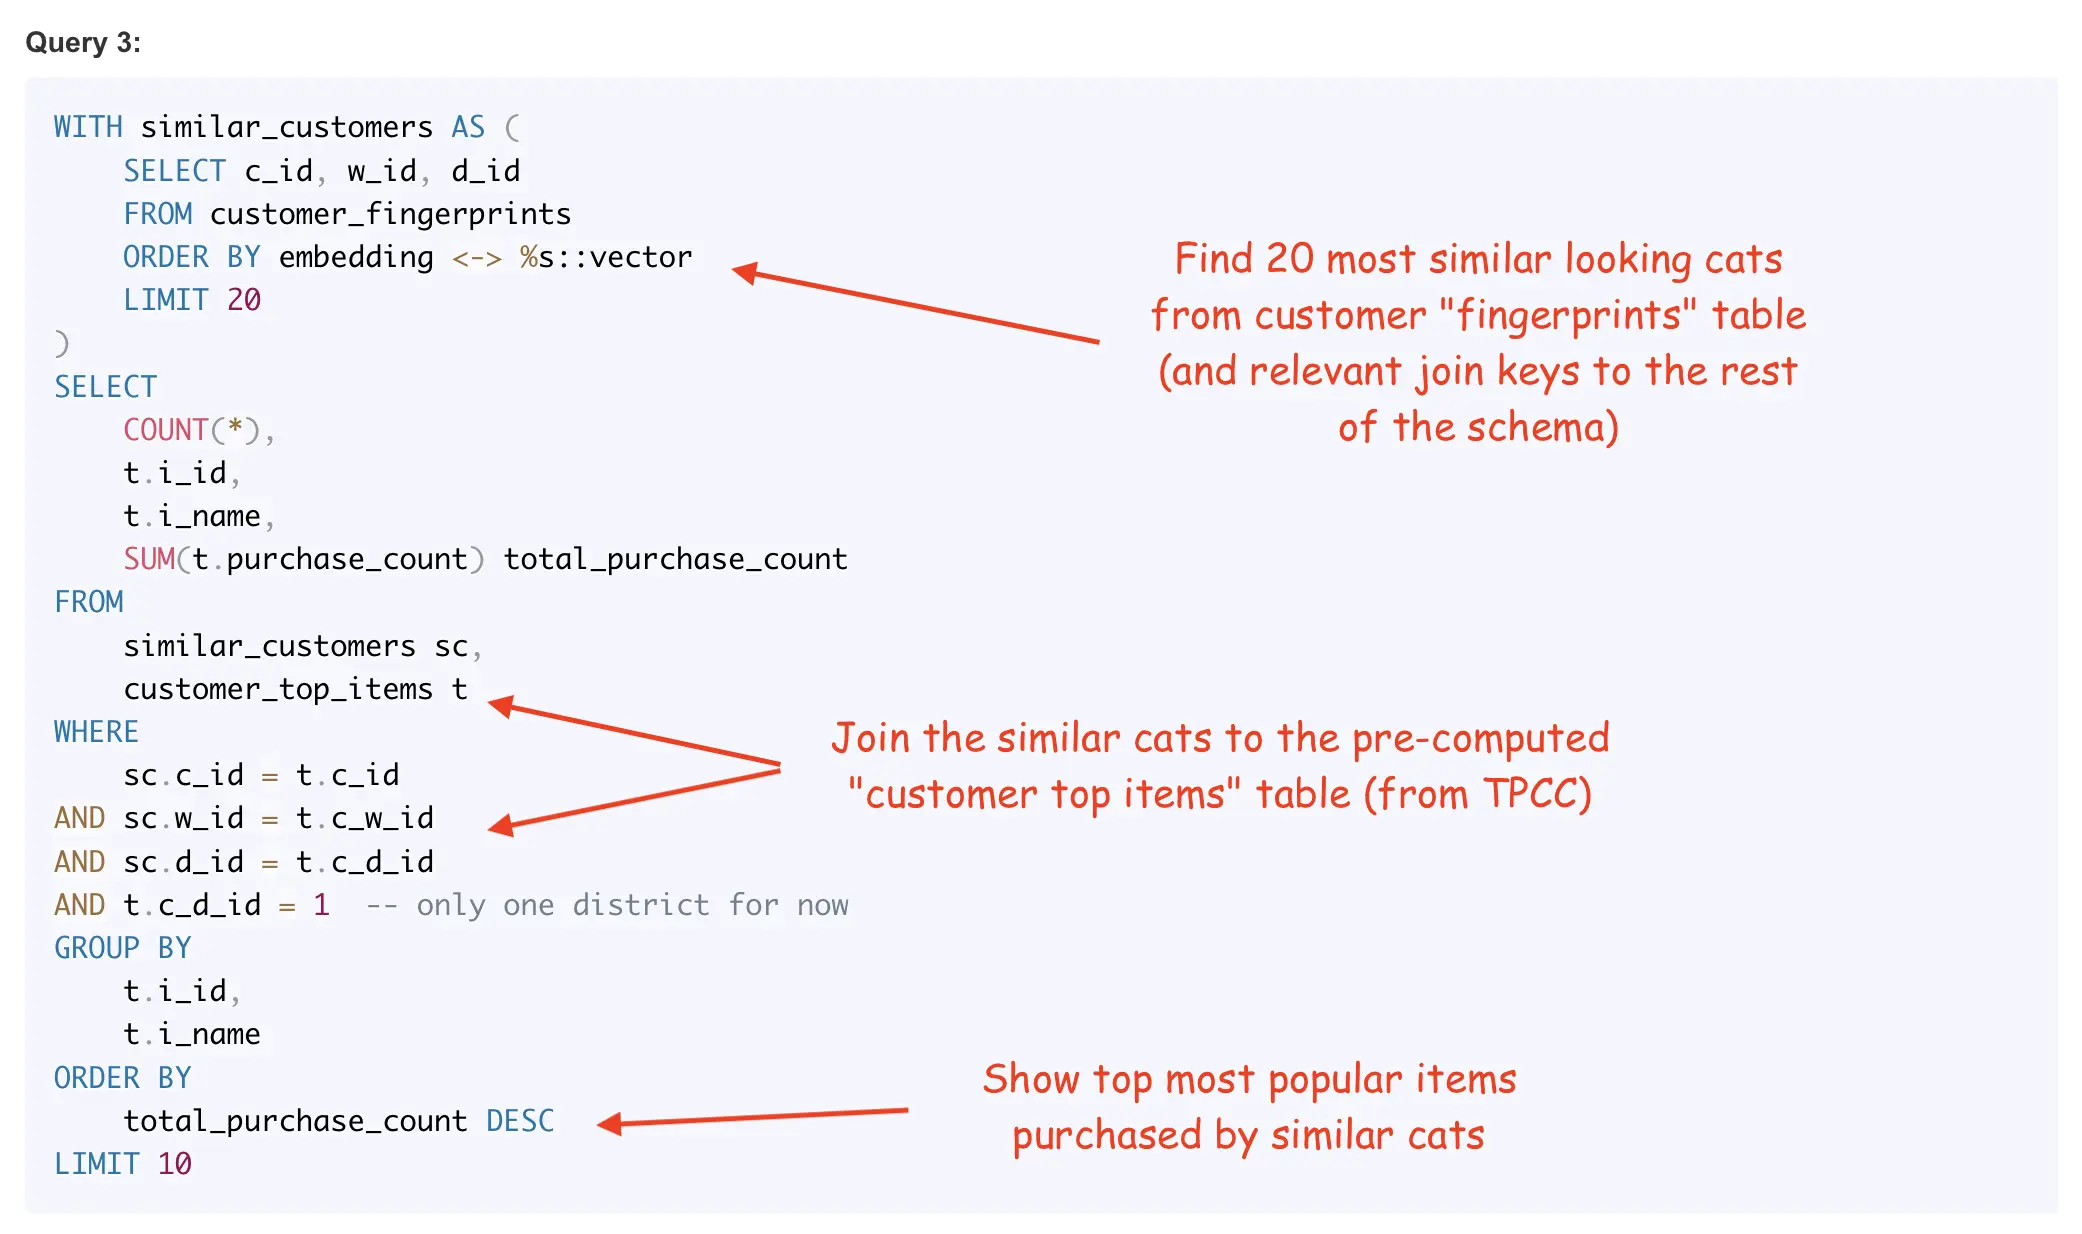
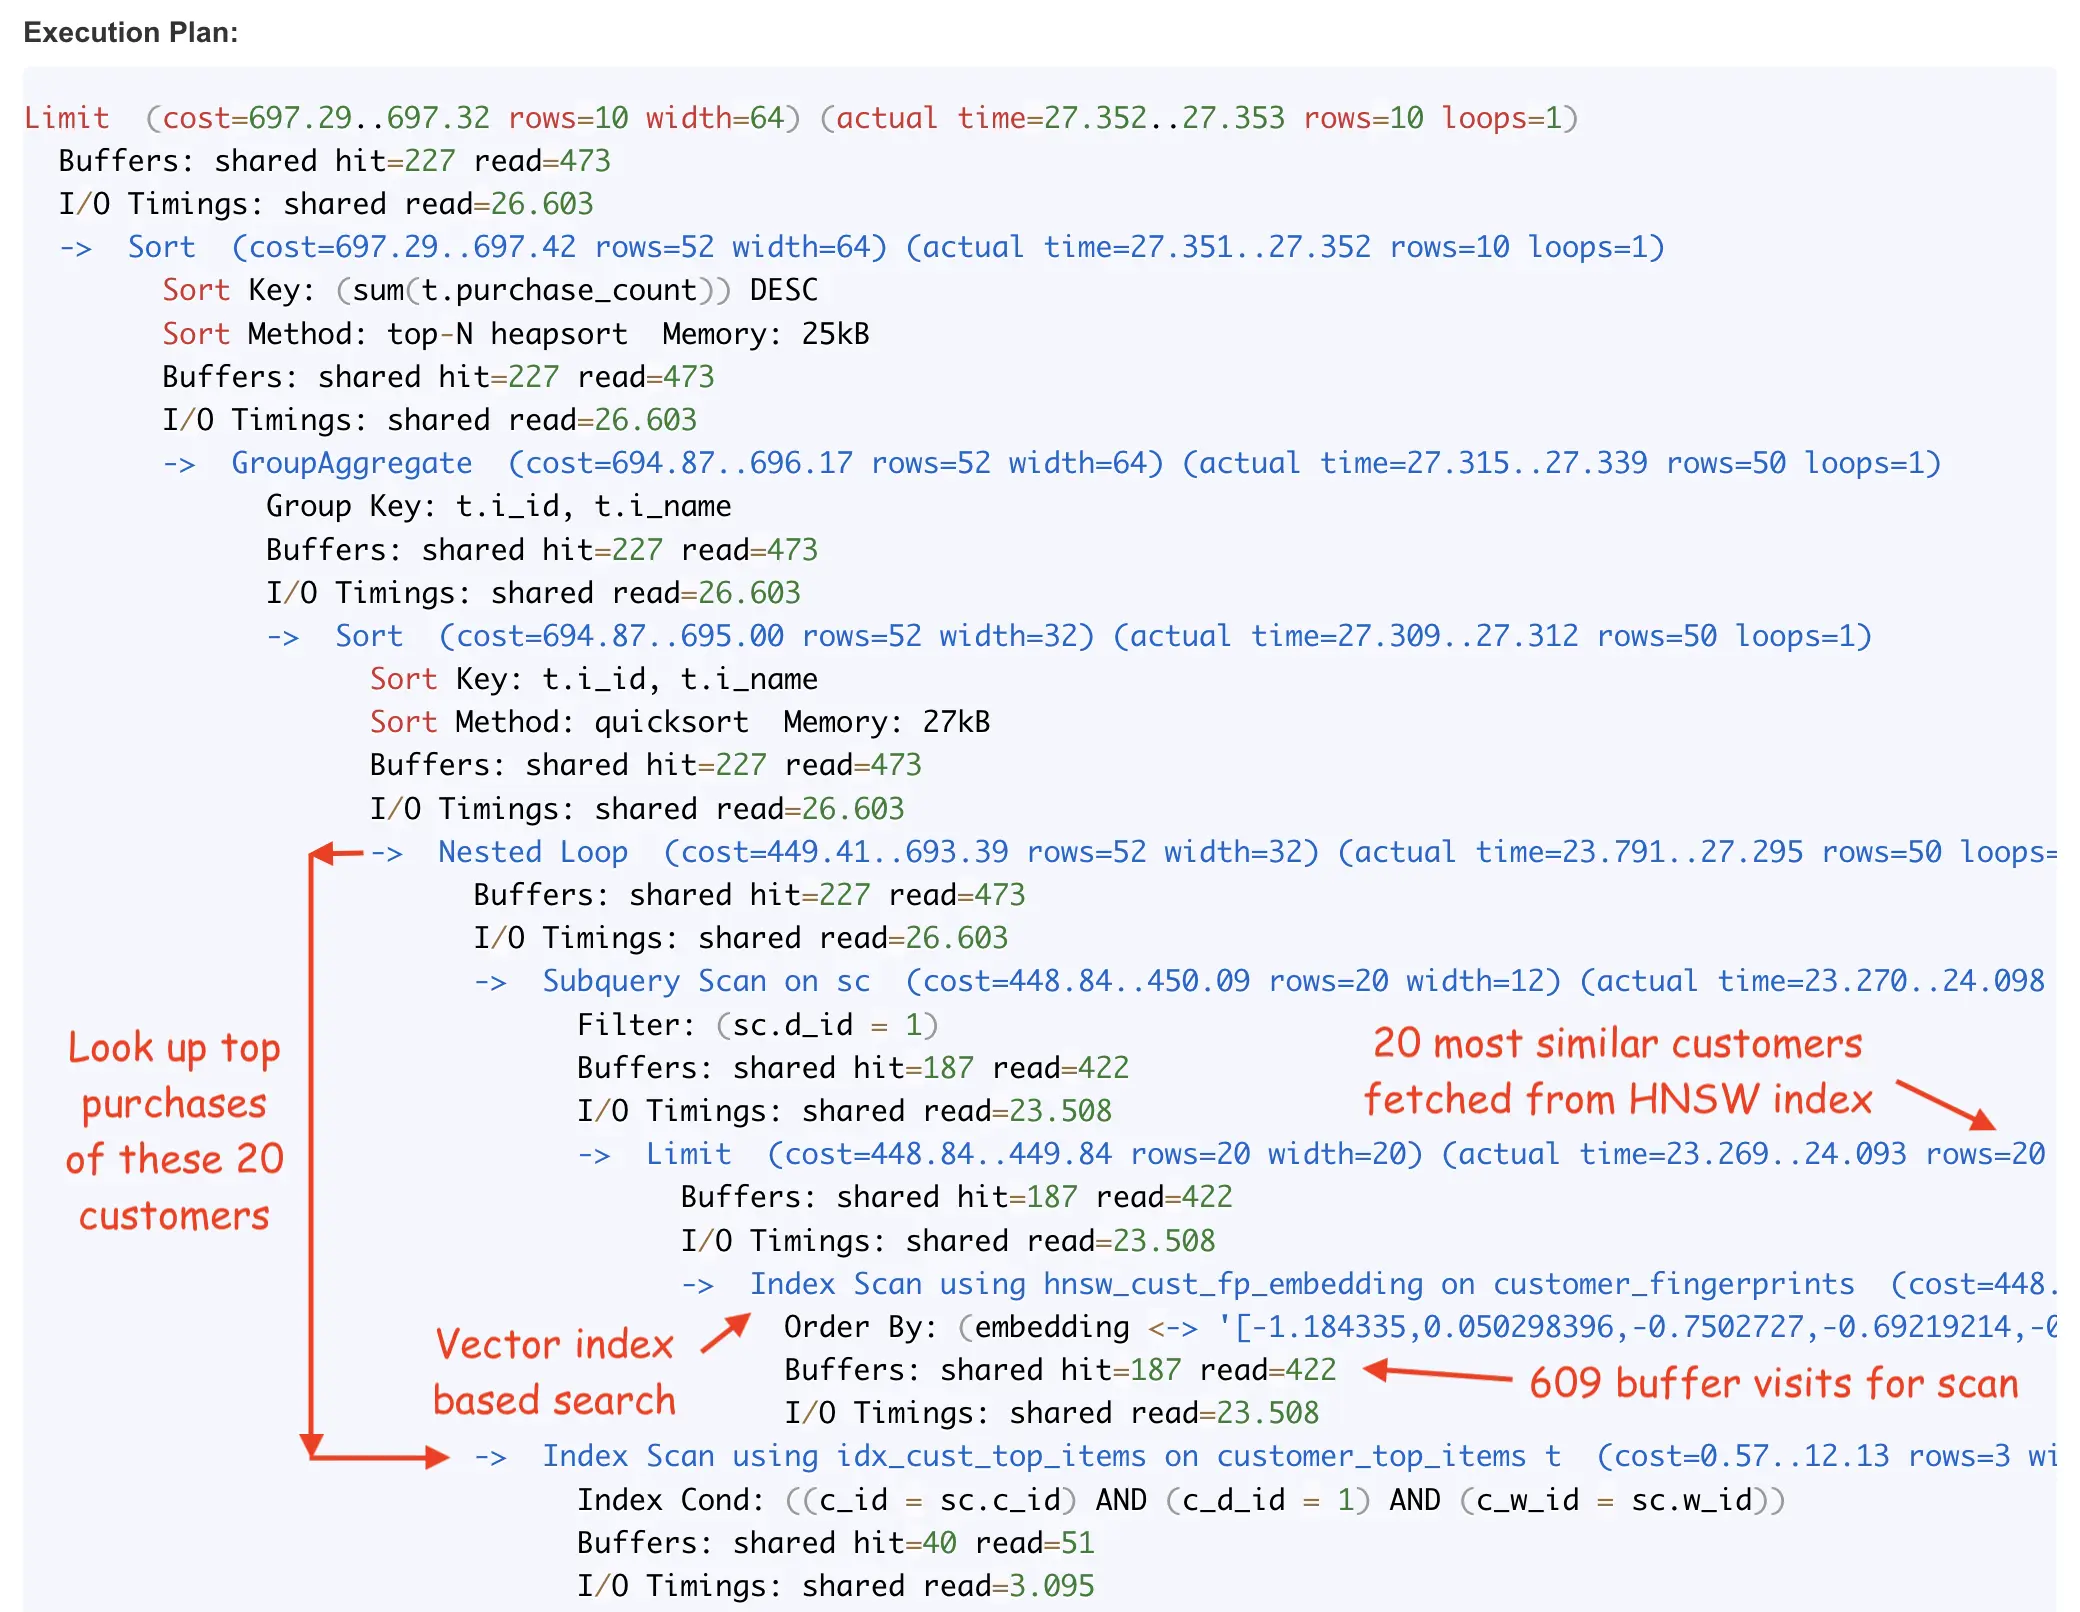
This gives you a nice sample of what your UI queries are waiting for, how many buffers they visit and how many rows they pass around the plan (including number of loops & revisits through some parts of your plan).
New in CatBench v0.3: Stress-test + Postgres instance-wide activity & SQL latency metrics
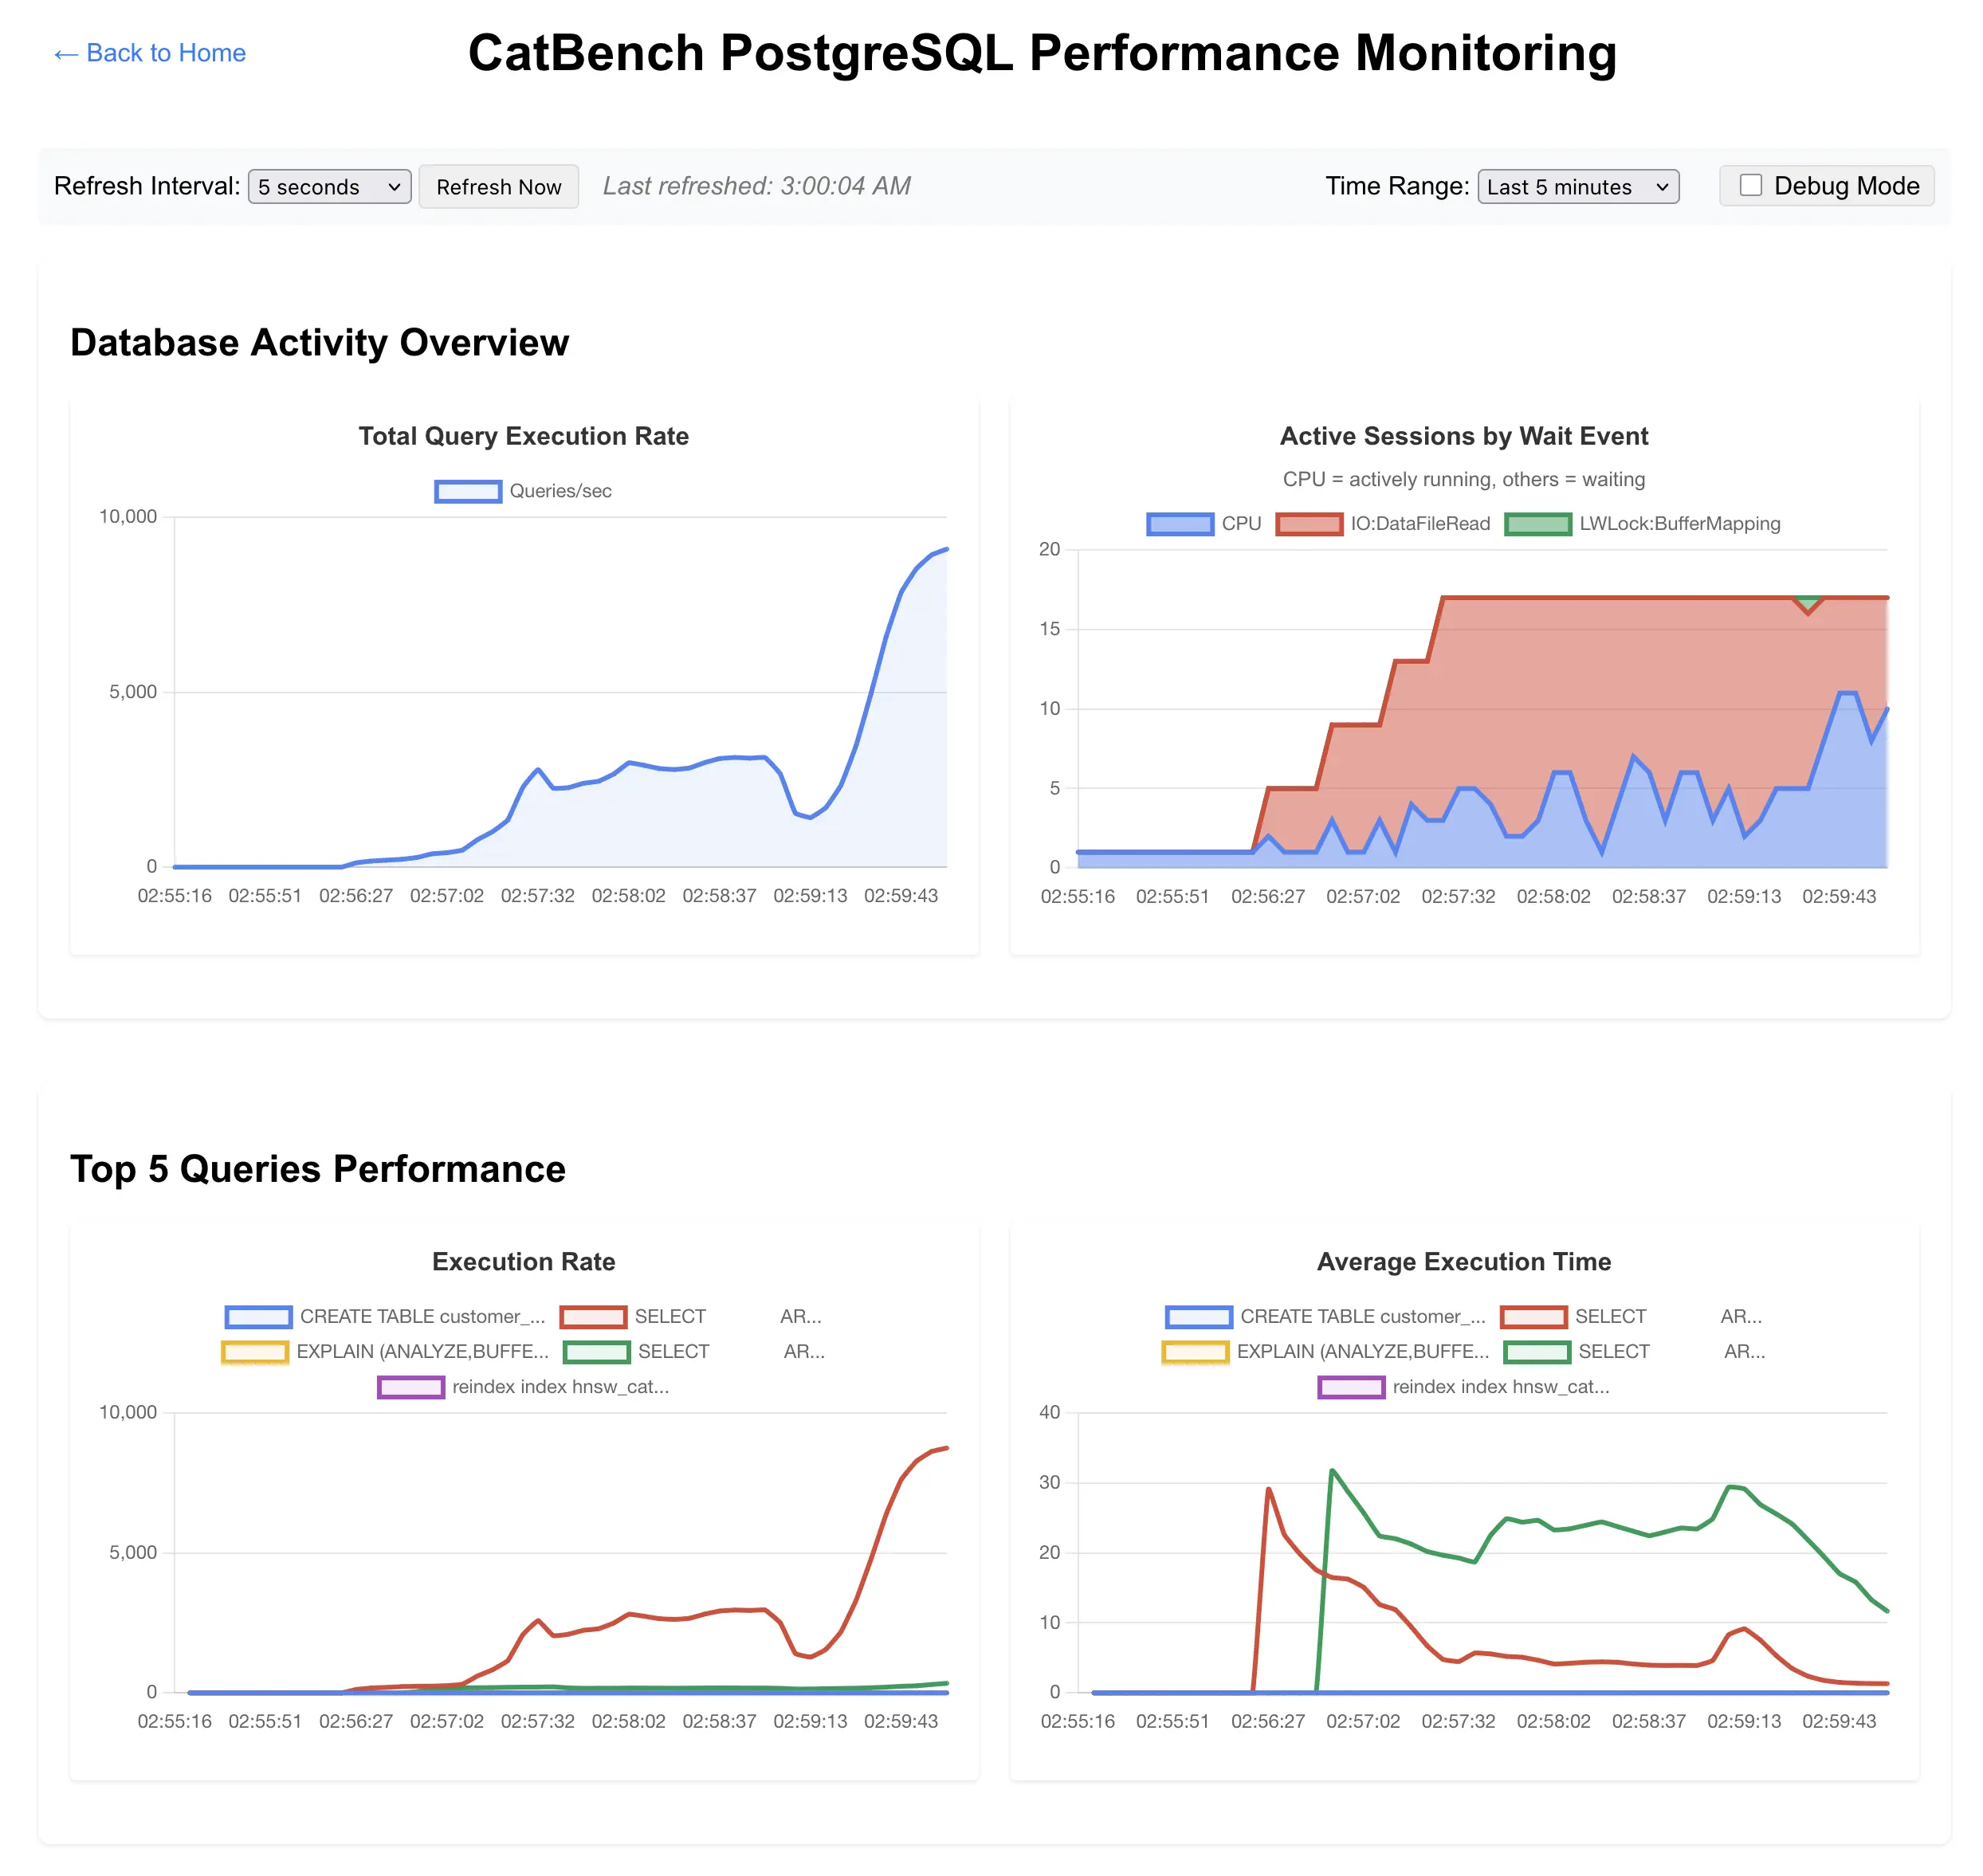
The latest version of CatBench has Postgres instance-wide throughput and average query execution latency charts built in. Now there’s a new button “Monitoring” on the CatBench landing page. I usually open it in a new tab while navigating around the rest of the app.
Here’s a screenshot from a test where I gradually increased the number of cat & dog similarity search query loops from 4 to 16 on a freshly restarted Postgres instance (and the OS pagecache had been cleared too):
More new stuff in the latest version
In addition to the query performance charts, it shows top queries in a tabular format too:
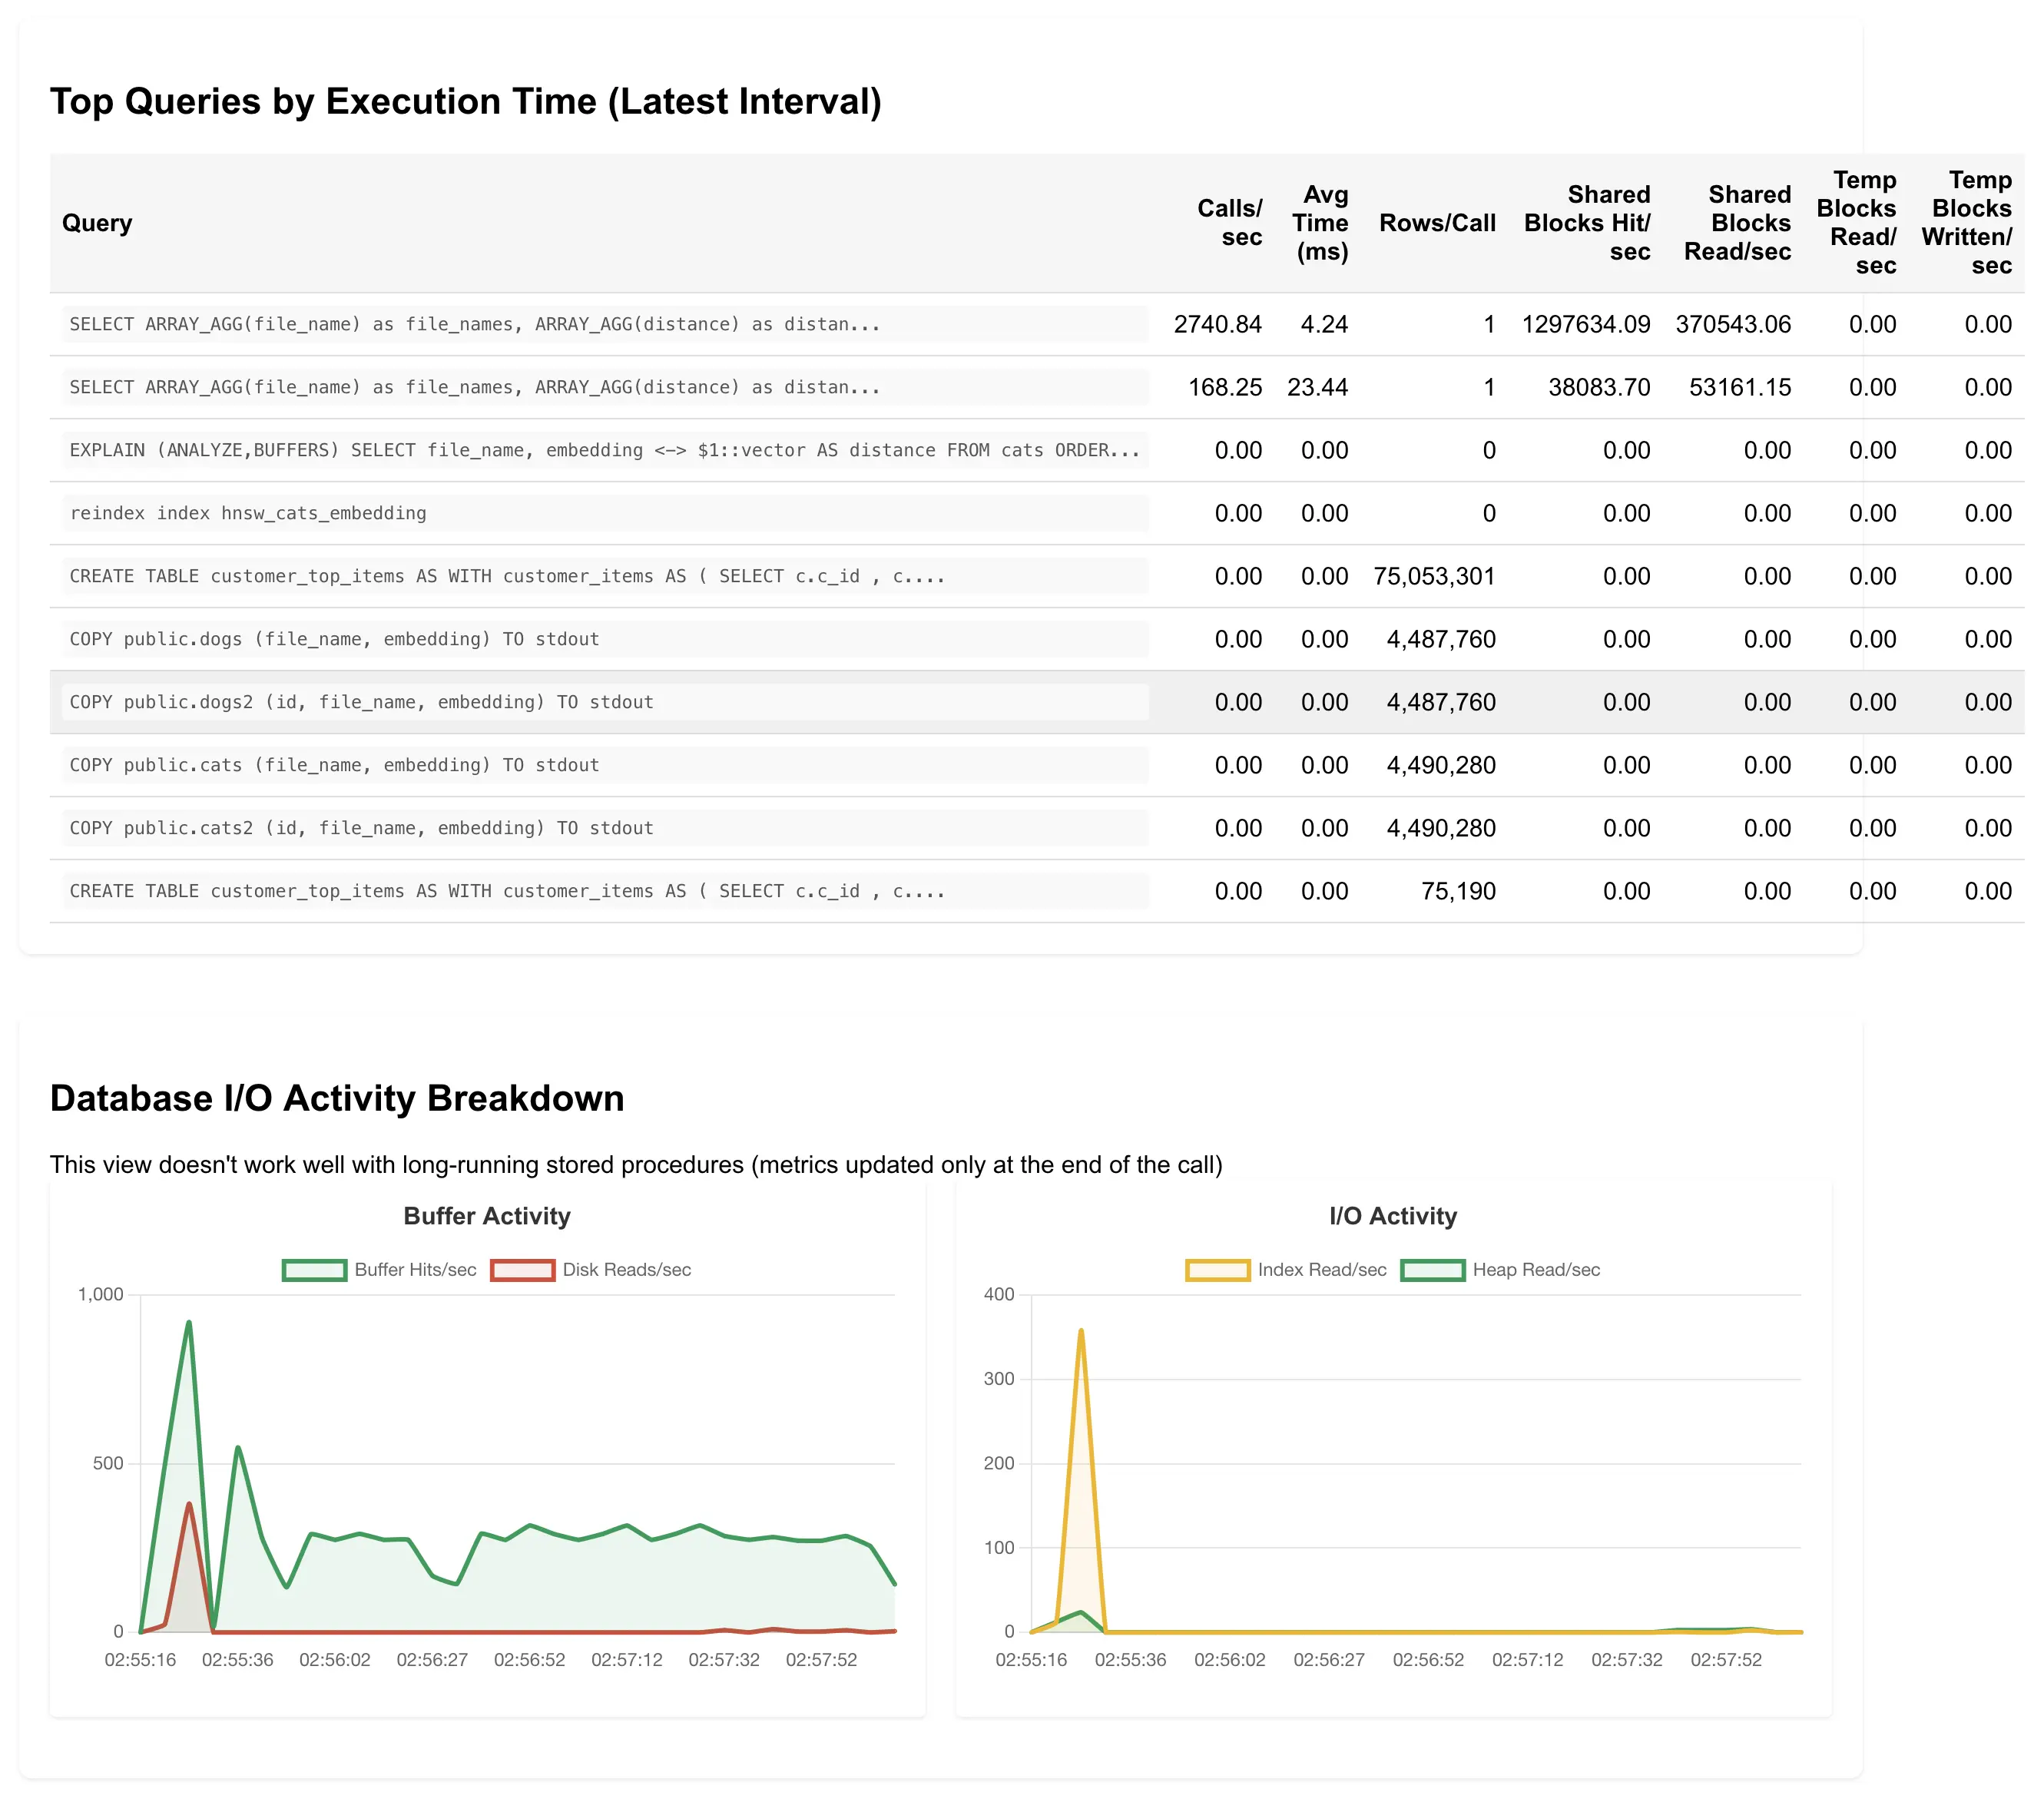
I moved a couple of charts into the bottom as they aren’t that useful/great yet, the Buffer Activity one is problematic as I use PL/PgSQL loops for running lots of concurrent similarity searches, but at least in my default configuration, the Buffer Activity metrics are not updated during the PL/PgSQL loop, so you don’t see much activity there, until the whole loop finishes (and then you get a huge spike that covers all the 10+ minutes of its runtime). More tweaking is needed.
Future plans
Other than tweaking/bugfixing, this is where I plan to go:
- Tidy up the code and install instructions for “exploding” the 25k photos to 9 million photos, by creating additional 359 copies of each photo (each rotated by one more degree). This also enables the next step:
- Add a recall quality monitoring for the “cat fraud detection” reverse lookup queries - this allows us to start playing with different vector index types and build configuration settings and have nice performance and recall quality charts to compare.
- Refactor the whole thing to support other databases too, not really for any competitive benchmarking reasons, but for additional learning and fun!
Check it out and leave feedback here:
Have fun! :-)
Notes
The whole app is meant to be a learning tool, an easy way to run some vector similariy search workloads (together with other application data) and be able to see the various query texts, execution plans and plan execution metrics when you navigate around. Currently you’d need to adjust/rebuild your database settings and vector index parameters manually, to compare how well some vector index type or setting works for you. I will automate some of these things in the future.
A previous announcement article with some more reasoning about what and why I’m building is here: