If you are wondering how the dimensional eBPF data collection works under the hood, check out my earlier post about xcapture: eBPF performance analysis and the 0x.tools repo
Summary
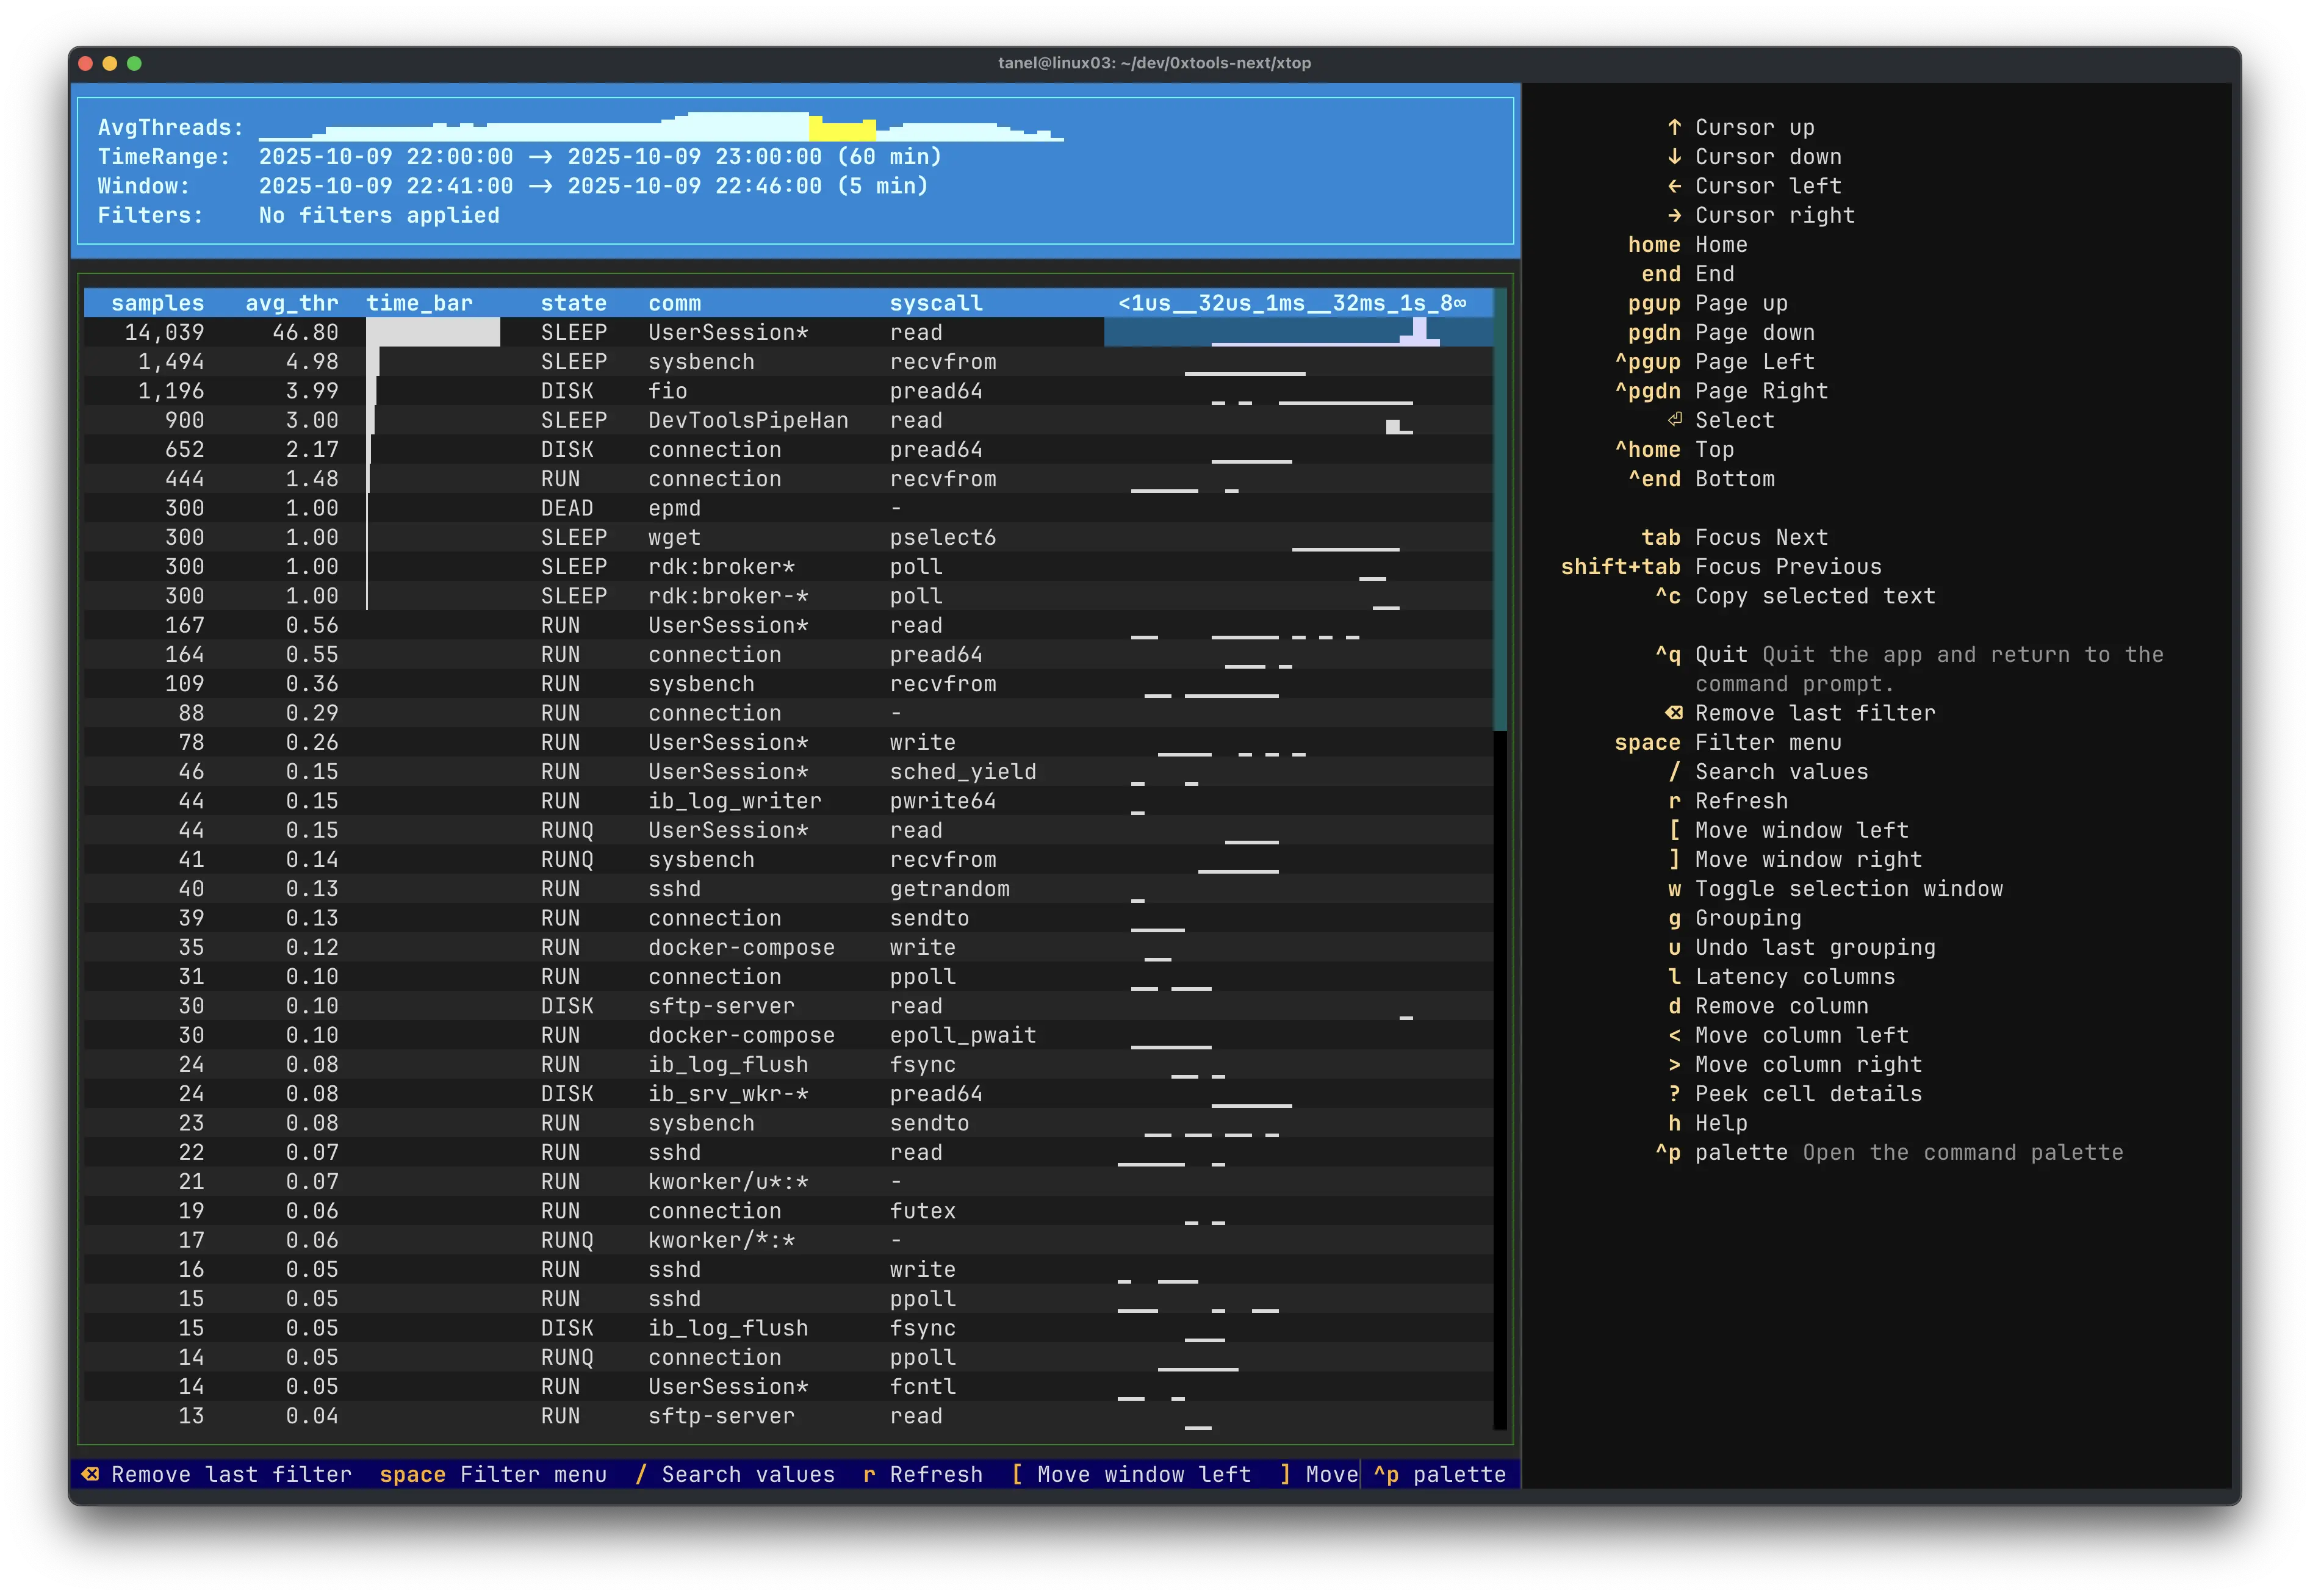
xtop is like the Linux top tool, but extended with x-ray vision and ability to view your performance data from any chosen angle (that eBPF allows to access). This enables dimensional performance analysis on Linux and tools like top for wall-clock time and much more. You can use it for system level overview and drill down into individual threads’ activity and even into kernel events like lock waits or memory stalls, with associated stack traces. eBPF is not only customizable, it’s completely programmable and I plan to take full advantage of it. I have so far implemented less than 10% of everything this method and the new tools are capable of.
Watch the 2-minute asciicast and 11-minute intro video below to see a sample of what I’ve built so far:
Asciicast (2 min)
Video (11 min)
How it works
xtop uses xcapture as its always-on, ultra-low overhead data source for continuously tracking and sampling thread activity in your system. If you want to learn how the eBPF tracking + sampling side works or want to see already released tool & usage examples, check out the previous xCapture v3 announcement and 0x.tools website:
- xCapture v3: Linux Performance Analysis with Modern eBPF and DuckDB
- 0x.tools (currently hosting previous v3.0.0-alpha code from a few months ago)

More to come!