Update: I just released xcapture v3.0.3 at P99 CONF, the first proper release of this whole concept! The 20-minute launch video is available for streaming on P99 CONF website.
Repo: github.com/tanelpoder/0xtools
The title and update say it all, I think it’s time to call the xcapture and xtop toolset ready for use now.
I plan to announce the production release (or at least a release candidate) at P99CONF this October. Holding myself back from adding more interesting features instead of fixing “boring” known issues is the hardest thing - eBPF can really give you superpowers!
I have added a few MB of compressed parquet files (and some CSVs) to the xtop/demo/ directory, so you can play with the xtop TUI even on your laptop, without having to run xcapture on some Linux machine first.
The 0x.tools repo link and four 1-minute asciicasts about different functionality (all based on the same xcapture data source!) are below:
Thread sleep and TCP connection metrics
Disk IO waits and filename/blockdevice latency drilldown
Kernel and user-level thread stack trace sampling
Text mode output for scripting and testing
Running xtop demo
It’s simple, works on Linux, Mac (Python 3.8+ should be ok) if you just want to navigate through the existing xcapture demo files using the xtop text UI. For running xcapture, you of course need to be on Linux and have a new enough kernel (instructions are in the GitHub repo).
For xtop, you need something like this:
source ~/dev/venv/bin/activate # use your own python venv
pip install duckdb textual

git clone https://github.com/tanelpoder/0xtools.git

cd 0xtools/xtop
export XCAPTURE_DATADIR=demo

./xtop
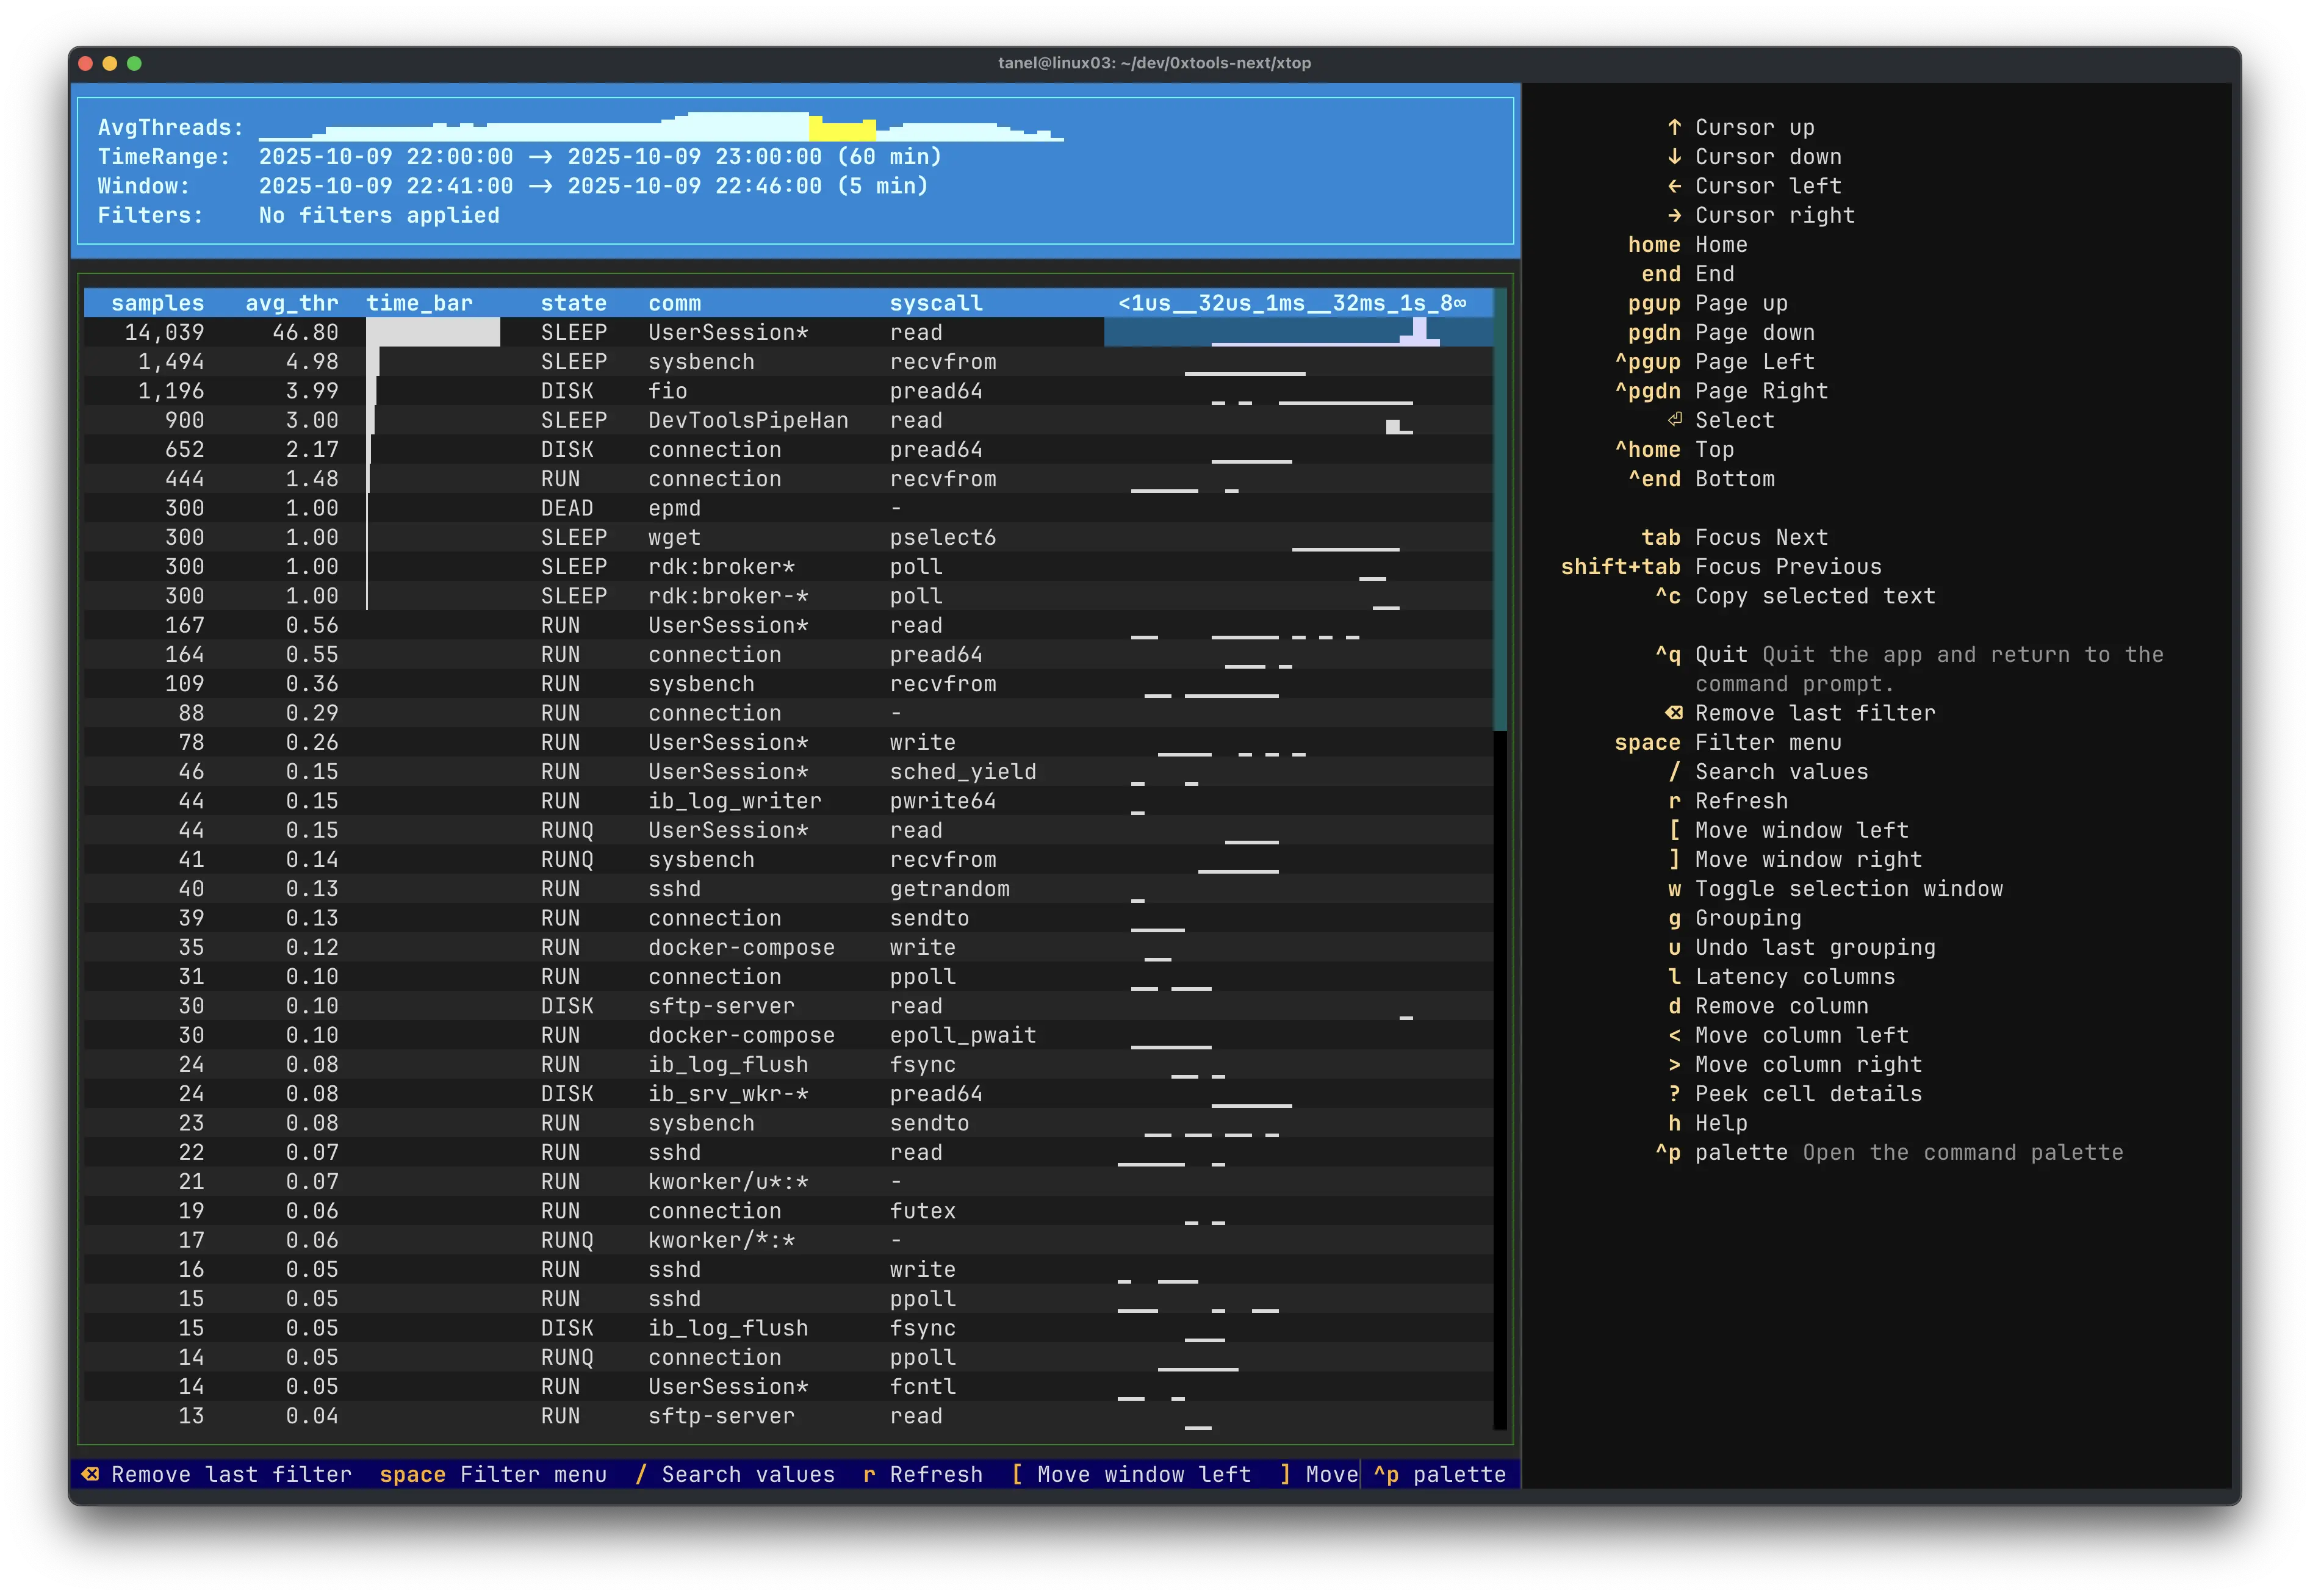
Running xtop without arguments will make it look up the latest hourly files in XCAPTURE_DATADIR location and visualize whatever is in there:
$ ls -lh $XCAPTURE_DATADIR
total 9.7M
-r--r--r-- 1 tanel tanel  900 Sep  8 15:56 partitions
-rw-rw-r-- 1 tanel tanel 1.2K Sep  8 15:56 xcapture_cgroups_2025-09-05.13.parquet
-rw-rw-r-- 1 tanel tanel 1.3K Sep  8 15:56 xcapture_cgroups_2025-09-05.14.parquet
-rw-rw-r-- 1 tanel tanel 1.5M Sep  8 15:56 xcapture_iorqend_2025-09-05.13.parquet
-rw-rw-r-- 1 tanel tanel 117K Sep  8 15:56 xcapture_iorqend_2025-09-05.14.parquet
-rw-rw-r-- 1 tanel tanel 1.4K Sep  8 15:56 xcapture_iorqmap_2025-09-05.13.parquet
-rw-rw-r-- 1 tanel tanel 1.4K Sep  8 15:56 xcapture_iorqmap_2025-09-05.14.parquet
-rw-rw-r-- 1 tanel tanel 5.8K Sep  8 15:56 xcapture_kstacks_2025-09-05.13.parquet
-rw-rw-r-- 1 tanel tanel  11K Sep  8 15:56 xcapture_kstacks_2025-09-05.14.parquet
-rw-rw-r-- 1 tanel tanel 3.8M Sep  8 15:56 xcapture_samples_2025-09-05.13.parquet
-rw-rw-r-- 1 tanel tanel 1.9M Sep  8 15:56 xcapture_samples_2025-09-05.14.parquet
-rw-rw-r-- 1 tanel tanel 1.9M Sep  8 15:56 xcapture_syscend_2025-09-05.13.parquet
-rw-rw-r-- 1 tanel tanel 582K Sep  8 15:56 xcapture_syscend_2025-09-05.14.parquet
-rw-rw-r-- 1 tanel tanel  13K Sep  8 15:56 xcapture_ustacks_2025-09-05.13.parquet
-rw-rw-r-- 1 tanel tanel  48K Sep  8 15:56 xcapture_ustacks_2025-09-05.14.parquet
You can also run xtop with --from and --to options (currently you need to use both, due to a bug):
$ ./xtop -d /home/tanel/dev/0xtools-next/xtop/demo \
  --from "2025-09-05T13:00:00" --to "2025-09-05T14:30:00" \
  --where "STATE='DISK'" -g state,username,comm,syscall,filenamesum,devname \
  --textmode --latency iolat_histogram --peek --limit 15
You can also see the (dynamically discovered) full column list that xtop has access to by running:
./xtop --list
And that is all!