Here are two scripts for showing GV$SYSMETRIC_HISTORY contents in a simple tabular way:
- vstat.sql - show up to one hour of current history at 1-minute granularity from memory
- awr/dstat.sql - show 1-minute granularity sysmetric history across your entire AWR history
The database metrics infrastructure was introduced back in Oracle 10g, so you (and built-in tuning advisors) could use typically needed metrics in a standardized precomputed manner, without having to do various V$ snapshots and performance counter math yourself.
Some of the metric types (metric groups) are described in the V$METRIC documentation. I used some of these metrics in my scripts to produce something vaguely similar to what Linux OS vmstat and dstat tools show, but for Oracle metrics.
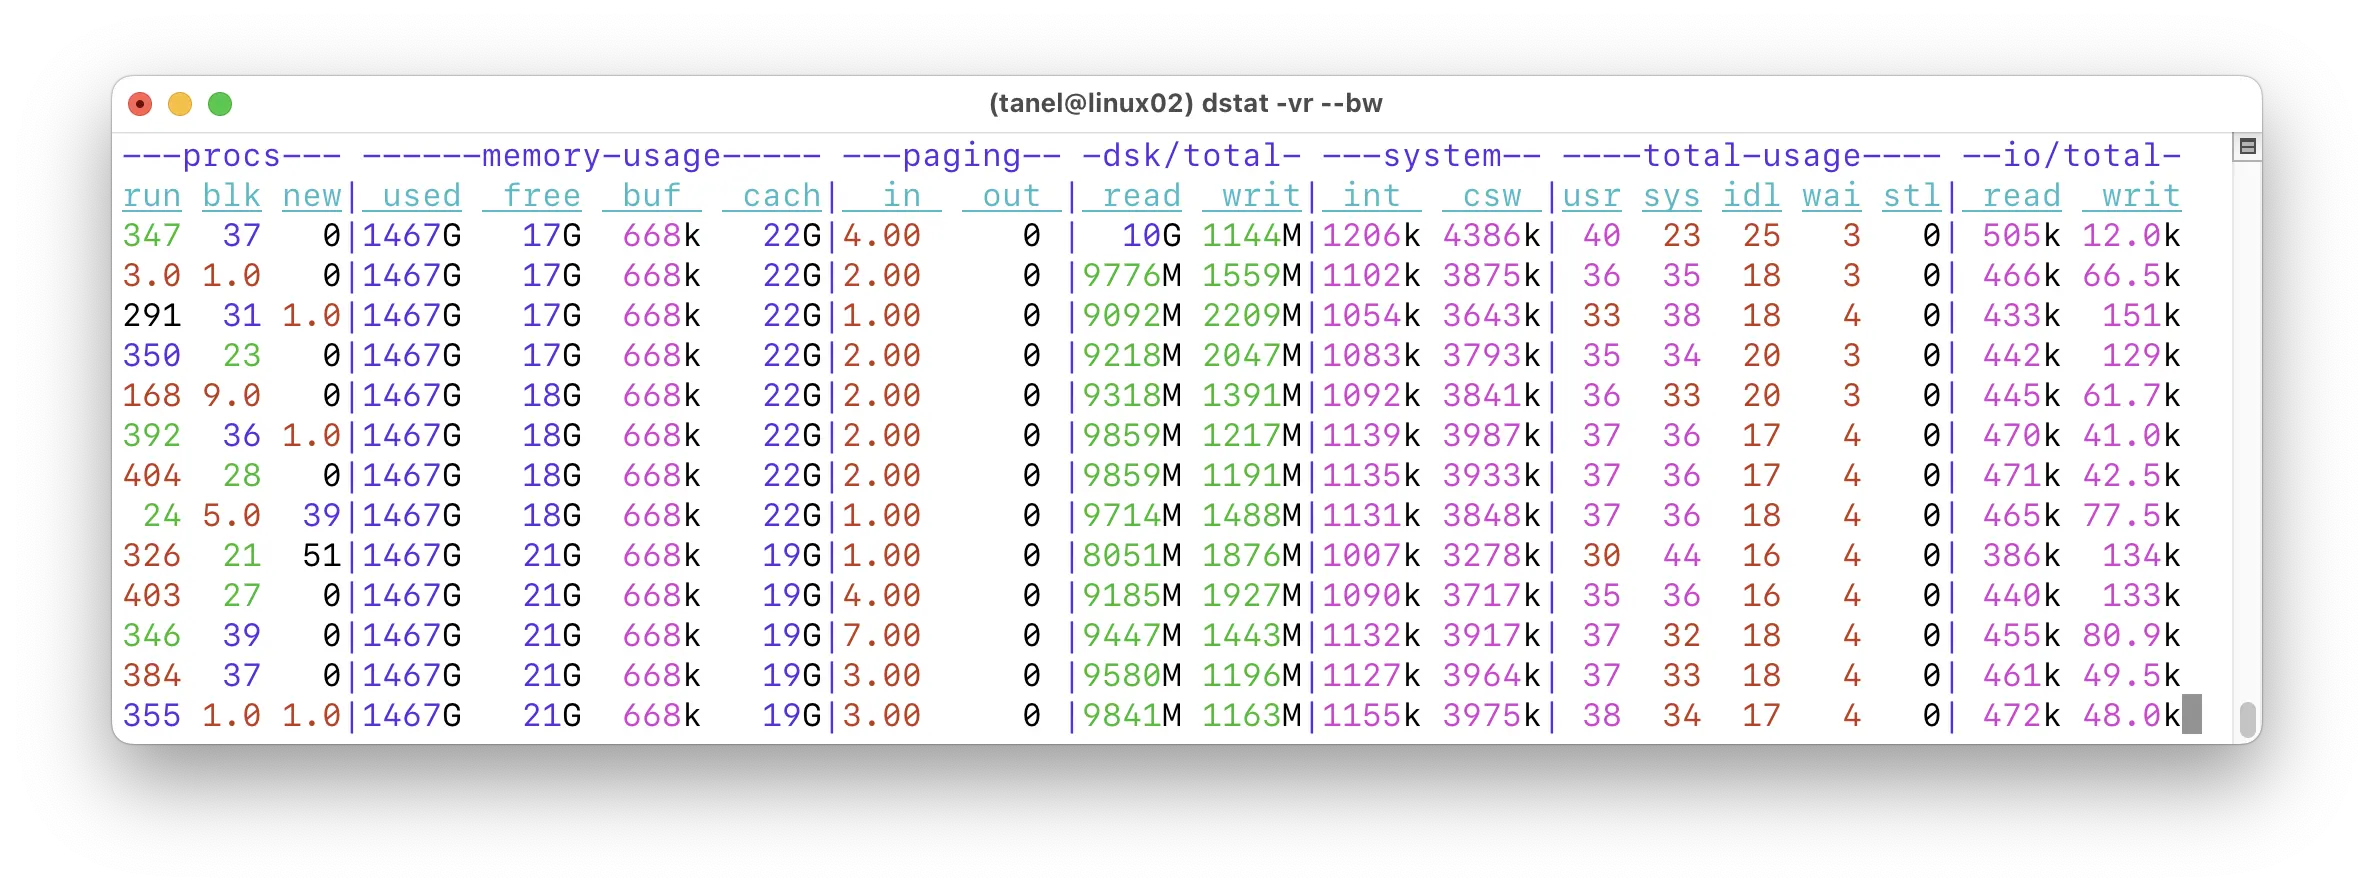
I like Linux dstat as it can show lots of different metrics in a tabular format and renders its columns neatly:
The Oracle vstat.sql script uses GV$SYSMETRIC_HISTORY view that calculates and stores Oracle performance metrics with a 1-minute granularity (and keeps only 60 minutes of history in memory). But these metrics are later stored in AWR history, retaining their per-minute granularity, regardless of your AWR snapshot interval. The awr/dstat.sql shows metrics from AWR, so you need a Diagnostics Pack license. But the V$ view-based short history does not, it should even work on Standard Edition. You could even write your own 5-line PL/SQL loop that wakes up every few minutes and persists the latest GV$ metrics into a custom history table.
Here’s a pretty wide screenshot of dstat.sql output, where I listed one hour of history from the total AWR timeline. You might want to right-click and open these images in a new browser tab to zoom in:

As the output is quite wide, you can use SQL Developer (or the new VS Code extension) that gives you vertical scrolling out of the box. Or you can just spool the output to a text file and open it with an editor to work around terminal wrapping issues.

You can look into the scripts to see from which metrics these columns come from and query V$METRICNAME (or use my metric.sql script) to see the metric descriptions and units, all self-documented by the database engine itself:
SQL> @metric sync

 GID GROUP_NAME                          METRIC_NAME                                      METRIC_UNIT
---- ----------------------------------- ------------------------------------------------ ---------------------------------------------
   2 System Metrics Long Duration        Average Synchronous Single-Block Read Latency    Milliseconds

SQL> @metric redo

 GID GROUP_NAME                          METRIC_NAME                   METRIC_UNIT
---- ----------------------------------- ----------------------------- ------------------------------
   2 System Metrics Long Duration        Redo Allocation Hit Ratio     % (#Redo - RedoSpaceReq)/#Redo
   2 System Metrics Long Duration        Redo Generated Per Sec        Bytes Per Second
   2 System Metrics Long Duration        Redo Generated Per Txn        Bytes Per Txn
   2 System Metrics Long Duration        Redo Writes Per Sec           Writes Per Second
   2 System Metrics Long Duration        Redo Writes Per Txn           Writes Per Txn
   3 System Metrics Short Duration       Redo Generated Per Sec        Bytes Per Second
   3 System Metrics Short Duration       Redo Generated Per Txn        Bytes Per Txn
   3 System Metrics Short Duration       Redo Writes Per Sec           Writes Per Second
   3 System Metrics Short Duration       Redo Writes Per Txn           Writes Per Txn
  18 PDB System Metrics Long Duration    Redo Generated Per Sec        Bytes Per Second
  18 PDB System Metrics Long Duration    Redo Generated Per Txn        Bytes Per Txn
  18 PDB System Metrics Long Duration    Redo Writes Per Sec           Writes Per Second
  18 PDB System Metrics Long Duration    Redo Writes Per Txn           Writes Per Txn
Or you can just run @metric % to see all metrics and their descriptions, I get over 400 rows of output on Oracle 19c. By the way, not all computed metrics are stored in the metric history views.
These metrics are essentially standardized computations based on various performance counter views (like V$SYSSTAT). I like that they’re stored with 1-minute granularity even in AWR, so you can get a more detailed view into spikes in the system utilization and latencies, without writing custom collector scripts or using sampled data from ASH.
I have added some syntax examples to the latest help.sql too:
SQL> @help vstat

NAME               DESCRIPTION                                              USAGE
------------------ -------------------------------------------------------- ----------------------------------------------------------------------------
vstat.sql          Display recent system metrics history from V$ in memory  @vstat <from_time> <to_time>
                                                                            @vstat sysdate-1/24 sysdate


SQL> @help dstat

NAME               DESCRIPTION                                              USAGE
------------------ -------------------------------------------------------- ----------------------------------------------------------------------------
dstat.sql          Display system metrics history from AWR                  @awr/dstat <from_time> <to_time>
                                                                            @awr/dstat "timestamp'2025-10-07 07:00:00'" "timestamp'2025-10-07 08:00:00'"