Starting from Python 3.12, you can instruct Python to enable direct perf profiling support for your Python code. This feature currently works only on Linux, as it communicates the relationships between Python-level interpreted function calls and machine-code level return pointers (for stack unwinding) via perf map files. The Linux perf tool knows how to read these files and maps the return pointers in a thread’s stack to the corresponding Python-level symbols (similar to what JVM JIT code profiling with Perf maps does).
Just creating a /tmp/perf-PID.map file with the mappings is not enough though as the Python interpreter does not use the low-level (binary machine code) calling conventions & ABI for keeping track of its high level state. That’s why you’ll need to enable the additional instrumentation using one of the options mentioned in the Python support for the Linux perf profiler document 1.
First, you’ll have to verify that your Python version supports generating the machine code trampolines that are injected just before each Python function call, so that they’d show up in the stack for tools like Perf to consume:
$ python -m sysconfig | grep HAVE_PERF_TRAMPOLINE
  PY_HAVE_PERF_TRAMPOLINE = "1"
Indeed, my Python 3.12 installation (on Ubuntu 24.04) has it enabled. One of the 3 ways to enable the extra instrumentation is to run the entire Python program with the PYTHONPERFSUPPORT environment variable set. No code changes are needed!
I’ll start by running my Linux thread state sampler tool psn (part of 0x.tools), with extra instrumentation enabled. This tool just samples various files under /proc/PID/task/TID/ in a Python loop and prints out a summary of OS level thread activity:
$ sudo PYTHONPERFSUPPORT=1 perf record -F 997 -g psn -G syscall,wchan,filenamesum

Linux Process Snapper v1.2.6 by Tanel Poder [https://0x.tools]
Sampling /proc/stat, syscall, wchan for 5 seconds...
finished.

=== Active Threads ==========================================================================================================================

 samples | avg_threads | comm          | state                  | syscall         | wchan                   | filenamesum
---------------------------------------------------------------------------------------------------------------------------------------------
      10 |        0.15 | (dpkg)        | Running (ON CPU)       | [running]       | 0                       |
       4 |        0.06 | (apt)         | Running (ON CPU)       | [running]       | 0                       |
       3 |        0.04 | (http)        | Running (ON CPU)       | pselect6        | 0                       |
       2 |        0.03 | (dpkg)        | Disk (Uninterruptible) | sync_file_range | rq_qos_wait             |
       2 |        0.03 | (jbd*/dm-*-*) | Disk (Uninterruptible) | [kernel_thread] | __wait_on_buffer        |
       1 |        0.01 | (dpkg)        | Disk (Uninterruptible) | fsync           | jbd2_log_wait_commit    | /var/lib/dpkg/tmp.ci/postinst
       1 |        0.01 | (dpkg)        | Disk (Uninterruptible) | fsync           | jbd2_log_wait_commit    | /var/lib/dpkg/updates/tmp.i
       1 |        0.01 | (http)        | Disk (Uninterruptible) | close           | rq_qos_wait             |
       1 |        0.01 | (http)        | Running (ON CPU)       | [running]       | 0                       |
       1 |        0.01 | (jbd*/dm-*-*) | Disk (Uninterruptible) | [kernel_thread] | 0                       |
       1 |        0.01 | (kworker/*:*+ | Disk (Uninterruptible) | [kernel_thread] | i915_hpd_poll_init_work |
       1 |        0.01 | (sshd)        | Running (ON CPU)       | [running]       | 0                       |


samples: 67
(expected: 100)
total processes: 333, threads: 443
runtime: 5.05, measure time: 5.03
[ perf record: Woken up 5 times to write data ]
[ perf record: Captured and wrote 1.472 MB perf.data (5134 samples) ]
I use “sudo” because I’ve been too lazy to configure the Linux kernel to be less paranoid about Perf in my lab machines. The PYTHONPERFSUPPORT environment variable is propagated all the way to the Python interpreter. The psn command takes 5 seconds to run by default and the last output lines above show that Perf did capture some (on-CPU) stack samples while it was running.
Now I’ll just run perf report and hopefully some high level Python symbols show up:
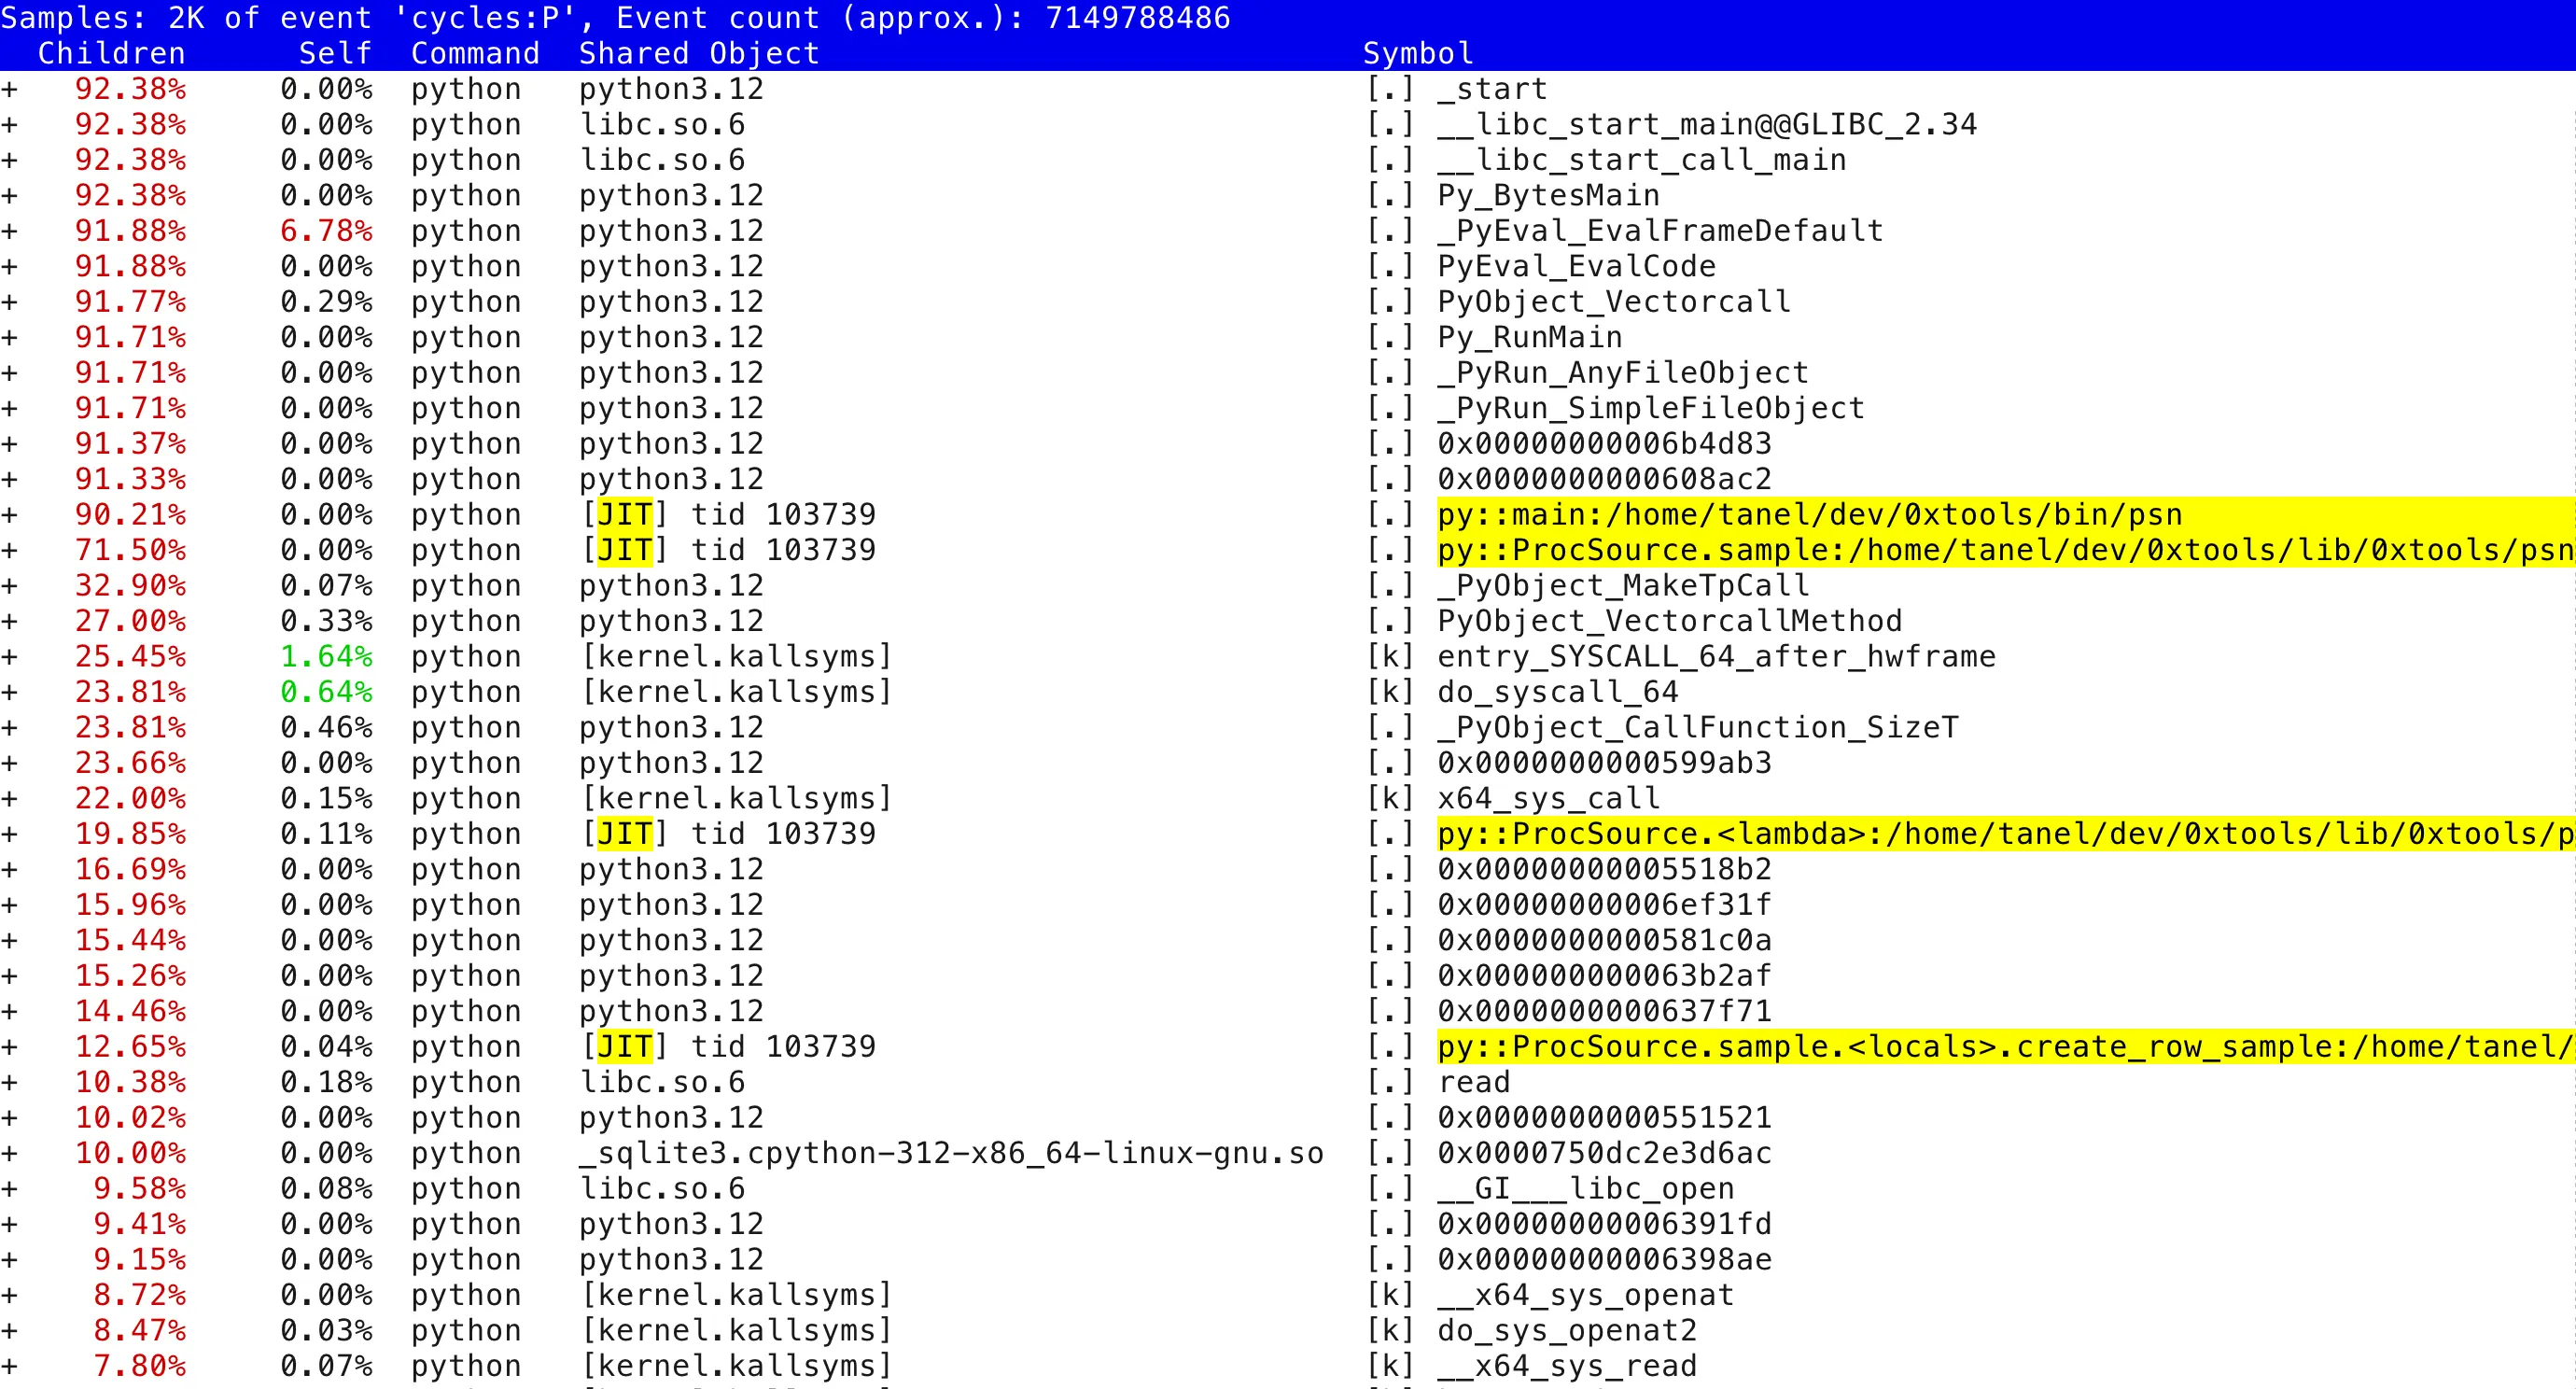
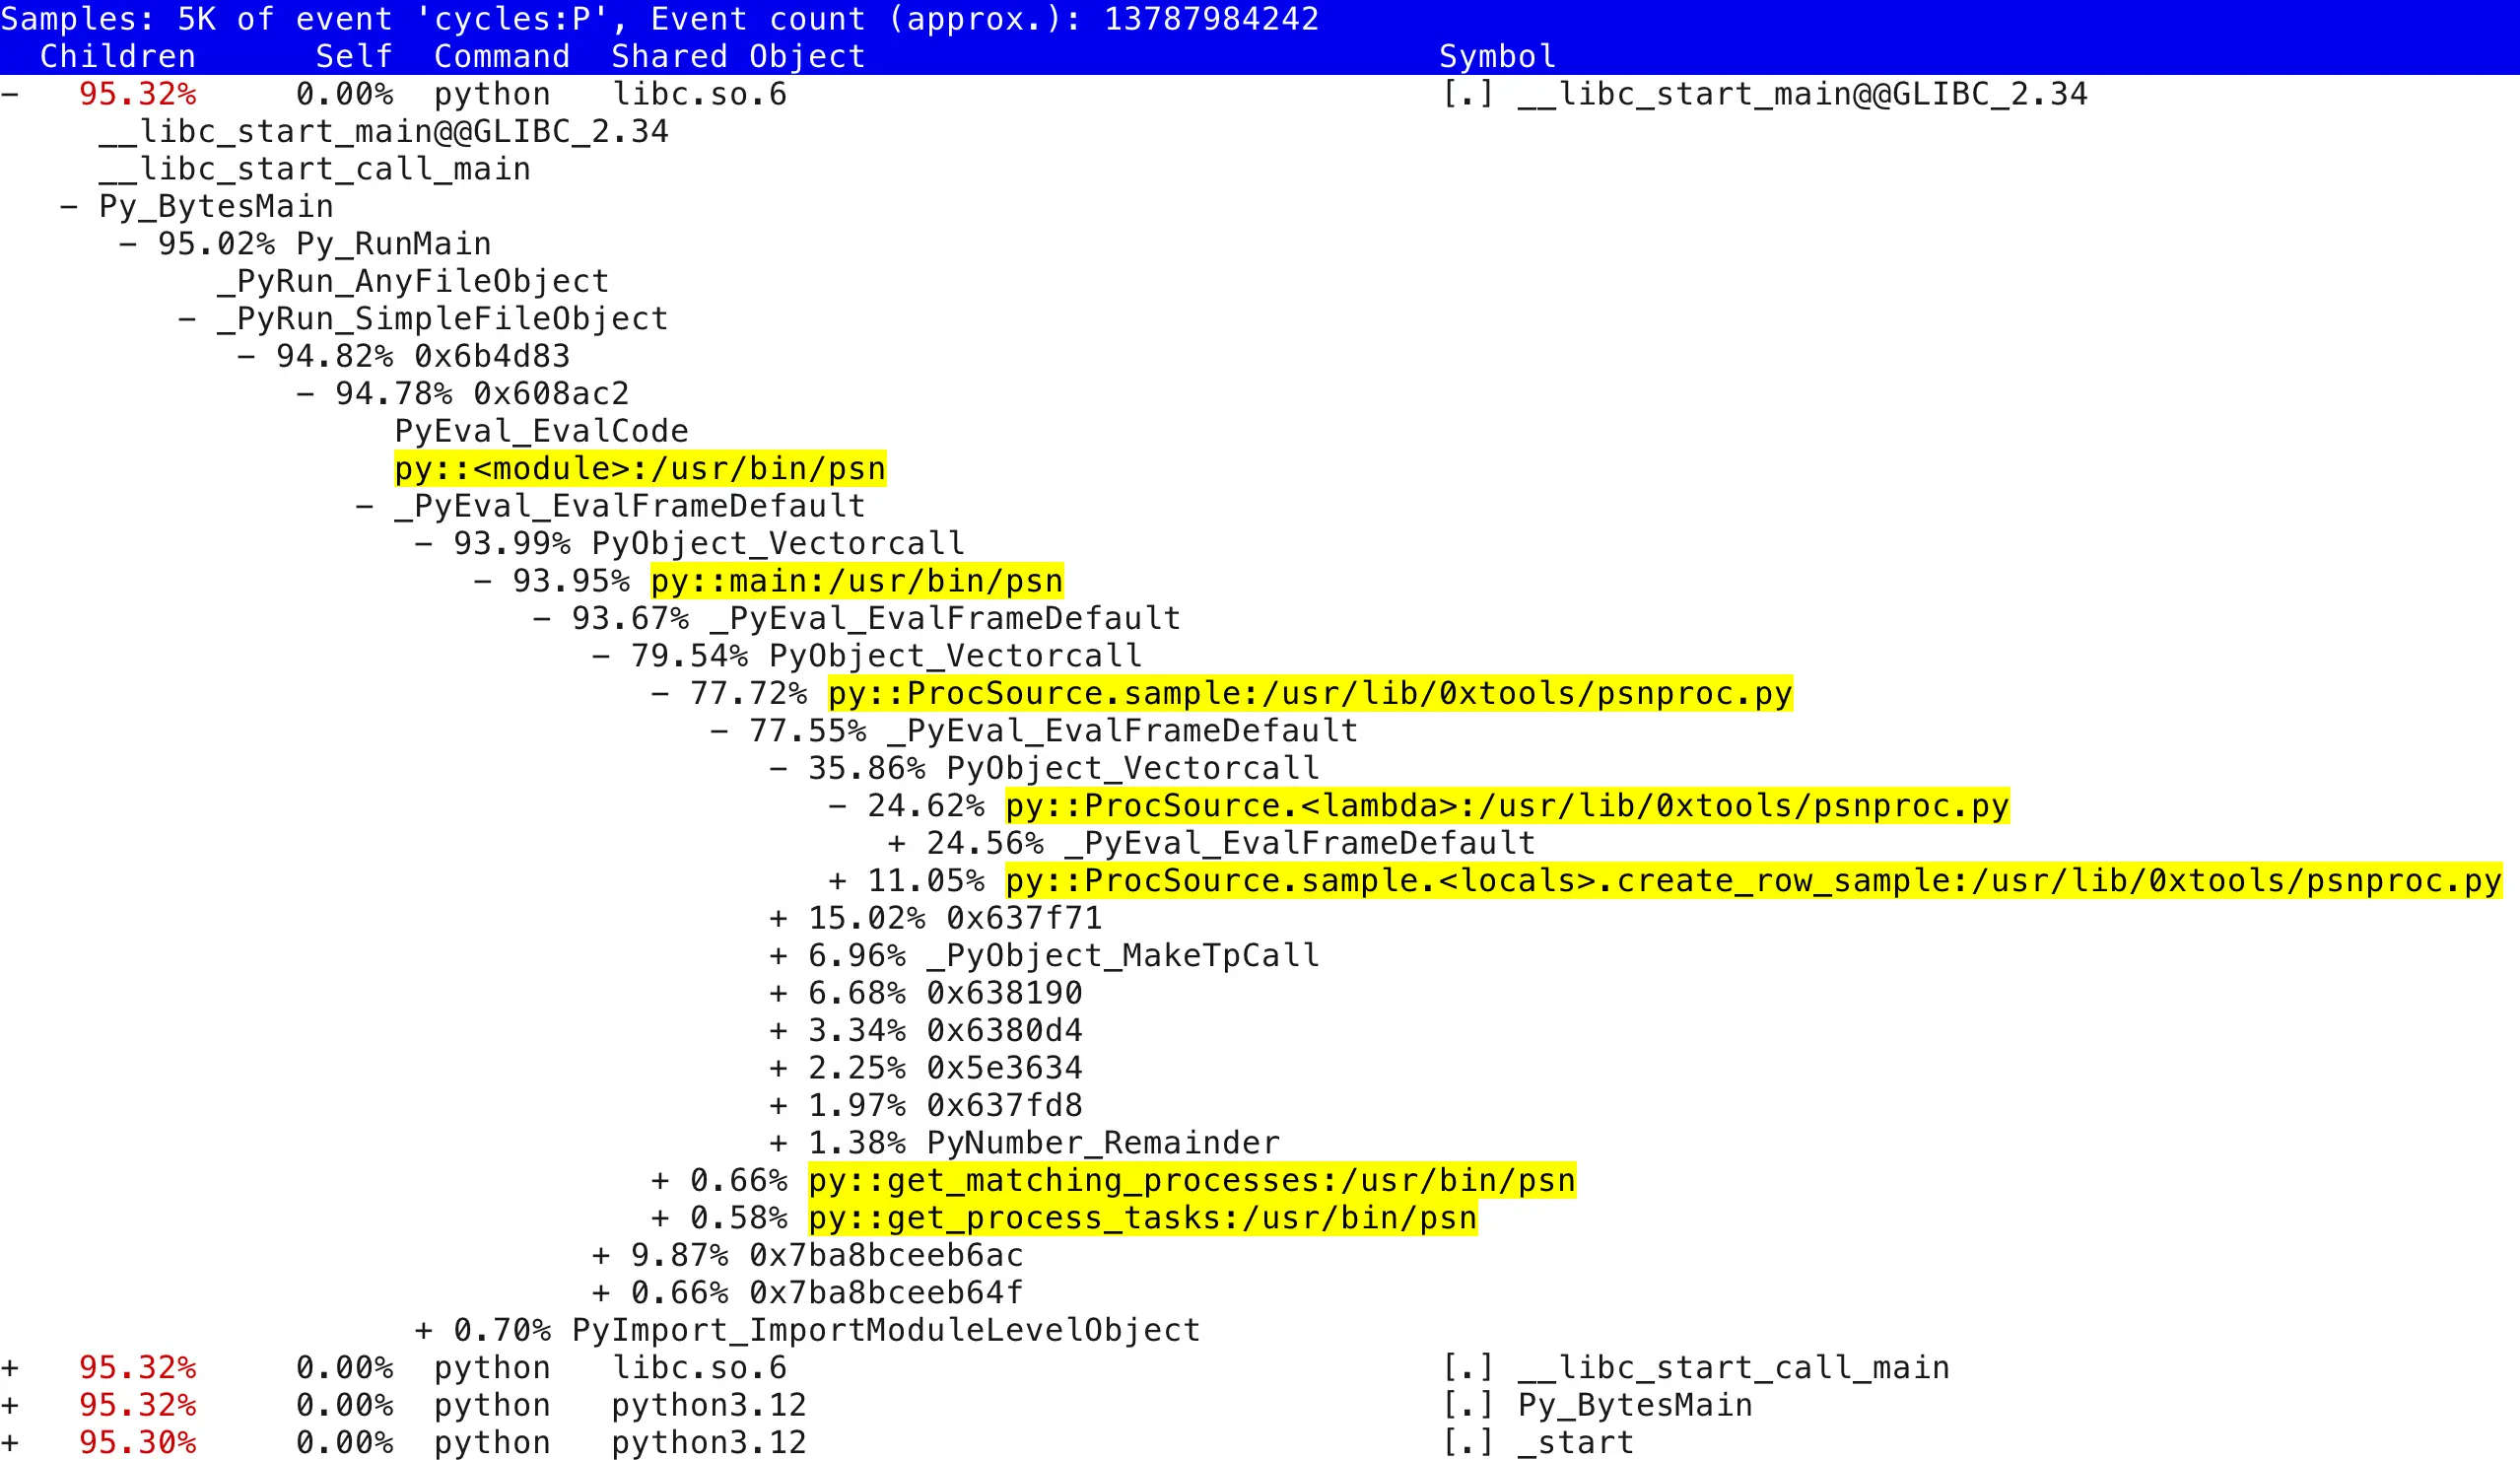
Indeed, a bunch of my Python functions (even lambdas!) show up, so this thing must work, somehow! Note the [JIT] tid 103739 listed as a binary executable object in the process address space that Perf’s stack walking mechanism has discovered. These objects do not exist in any compiled on-disk file and that’s exactly where this Python new feature comes in. Before explaining that, here’s a similar report, expanded to a few levels deeper:
Python still interprets its code as usual and at the CPU/machine code instruction level you’d just see a small set of generic Python interpreter functions constantly being called, without any information about which high level function or method call was really interpreted. But the new trampoline injection mechanism makes the Python interpreter “physically” call a special binary function that’s dynamically set up in the JIT memory area just before continuing to interpret the called Python function’s bytecode as usual.
Calling those trampoline functions before proceeding with the actual Python code serves only one purpose - it saves a (binary) return pointer in the program stack that can then be read by tools like Perf and later translated to actual Python function names using the perf.map files. These trampolines do not do any other useful work or run any Python code, they’re there for low level instrumentation (return pointer saving) purposes only and jump right back into the Python interpreter, where the real action is.
This is where the Perf map files come in. If Python sets up its special trampoline sections to allow others to track its function call activity via return pointers in a thread’s stack, it will also emit the mapping information of a Python function and its trampoline address into the /tmp/perf-PID.map files. Perf knows how to read these files for translating stack return pointer addresses to human-readable symbols.
I’ll run a much simpler script for the next test that goes deeper into how the trampoline works. Here’s the /tmp/mysleep.py I use in the next test:
import time

def mysleep(s):
  time.sleep(s)

mysleep(999)
I won’t even use sudo or Perf here as I just want to see how does Python 3.12 itself set up the trampolines:
$ PYTHONPERFSUPPORT=1 python /tmp/mysleep.py &
[1] 168825

$ ps -fp $!
UID          PID    PPID  C STIME TTY          TIME CMD
tanel     168825  162352  0 00:20 pts/1    00:00:00 python /tmp/mysleep.py
Ok, now we have a process 168825 that’s gonna be sleeping for a while, so now I can examine its state with things like GDB.
A bunch of perf-*.map files exist in the /tmp directory. Most of them are from my previous tests - the number in the filename is the PID (thread group ID) of the process that generated the map-file:
$ ls -ltr /tmp/perf-*map | tail
-rw------- 1 tanel tanel  19286 Jul 31 02:13 /tmp/perf-108902.map
-rw------- 1 tanel tanel  19286 Jul 31 02:14 /tmp/perf-108903.map
-rw------- 1 tanel tanel 100332 Jul 31 02:15 /tmp/perf-108945.map
-rw------- 1 tanel tanel 100332 Jul 31 02:15 /tmp/perf-108949.map
-rw------- 1 tanel tanel 100332 Jul 31 02:15 /tmp/perf-108951.map
-rw------- 1 tanel tanel  19189 Jul 31 02:35 /tmp/perf-109012.map
-rw------- 1 root  root   18993 Aug  1 00:19 /tmp/perf-168783.map
-rw------- 1 root  root   19461 Aug  1 00:19 /tmp/perf-168792.map
-rw------- 1 tanel tanel  19461 Aug  1 00:20 /tmp/perf-168799.map
-rw------- 1 tanel tanel  18993 Aug  1 00:20 /tmp/perf-168825.map
Since my Python program has a custom mysleep function in it, let’s look for it. I’m using -A1 to see the address of any following symbol, so I’d know if the grepped symbols are right next to each other (and I could calculate the potential binary code length under each symbol of interest):
$ grep -A1 mysleep /tmp/perf-168825.map
7f58cc58ecad b py:::/tmp/mysleep.py
7f58cc58ecb8 b py::mysleep:/tmp/mysleep.py
Ok, for this process, we see that there are some dynamically generated binary machine code “functions” at the listed addresses in this process’es virtual memory. These addresses do not exist as compiled machine code blocks within any on-disk binary, but were dynamically created on the fly for each interesting function by this new Python feature.
If we trust that the symbols addresses in the map file are ordered and don’t have gaps between them, we can calculate that the first mysleep.py symbol takes 11 bytes (0x7f58cc58ecb8 - 0x7f58cc58ecad = 11).
Update: this arithmetic is not needed, as the perf.map format above includes the object size. The “b” above is the size of the function/object of interest (0xb = 11 in decimal)
So let’s launch GDB on the still-sleeping process and see what’s in there:
$ sudo gdb -p 168825
...

(gdb) disas 0x703cd5af0cad,+11
Dump of assembler code from 0x703cd5af0cad to 0x703cd5af0cb8:
   0x0000703cd5af0cad:        sub    $0x8,%rsp
   0x0000703cd5af0cb1:        call   *%rcx
   0x0000703cd5af0cb3:        add    $0x8,%rsp
   0x0000703cd5af0cb7:        ret
End of assembler dump.
Indeed, it looks like the higher level Python interpreter calls this trampoline section that first adjusts the stack pointer (sub %rsp) and then jumps back right where the interpreter wants it to be, by calling whatever address the scratch register %rcx points to. Apparently, after all the interpretation under that Python symbol/function is done, the control is returned to the trampoline that then reverses its stack pointer adjustment (add %rsp) and the trampoline uses ret to transfer control back to whoever was its parent caller in the control flow.
In other words, the trampoline sections do not do any useful work, they just allow keeping track of return pointers for tools like Perf who’d want to unwind a more meaningful stack trace. This should mean that there would be no significant performance overhead, but you’d always have to test & verify this.
Since Perf can automatically translate the trampolines to useful Python-level symbols, my next question was whether GDB would also do it automatically. The trampoline instruction address where execution should continue from, once the call *%rcx function returns, would be 0x0000703cd5af0cb3, but apparently GDB doesn’t autotranslate it (yet):
(gdb) bt
#0  0x00007f58cc6eca7a in __GI___clock_nanosleep (clock_id=1, flags=1, req=0x7ffffb453a30, rem=0x0)
    at ../sysdeps/unix/sysv/linux/clock_nanosleep.c:78
#1  0x000000000064dbea in ?? ()
#2  0x0000000000581f32 in ?? ()
#3  0x0000000000549955 in PyObject_Vectorcall ()
#4  0x00000000005d7499 in _PyEval_EvalFrameDefault ()
#5  0x00007f58cc58ecbe in ?? ()
#6  0x00007ffffb453c90 in ?? ()
#7  0x00000000006bc1a8 in ?? ()
#8  0x0000000000549955 in PyObject_Vectorcall ()
#9  0x00000000005d7499 in _PyEval_EvalFrameDefault ()
#10 0x00007f58cc58ecb3 in ?? ()
#11 0x00007ffffb453e90 in ?? ()
#12 0x00000000006bc1a8 in ?? ()
#13 0x00000000005d5a21 in PyEval_EvalCode ()
#14 0x0000000000608ac2 in ?? ()
#15 0x00000000006b4d83 in ?? ()
#16 0x00000000006b4aea in _PyRun_SimpleFileObject ()
#17 0x00000000006b491f in _PyRun_AnyFileObject ()
#18 0x00000000006bc9c5 in Py_RunMain ()
#19 0x00000000006bc4ad in Py_BytesMain ()
#20 0x00007f58cc62a1ca in __libc_start_call_main (main=main@entry=0x518a50, argc=argc@entry=2, argv=argv@entry=0x7ffffb4542c8)
    at ../sysdeps/nptl/libc_start_call_main.h:58
#21 0x00007f58cc62a28b in __libc_start_main_impl (main=0x518a50, argc=2, argv=0x7ffffb4542c8, init=, fini=,
    rtld_fini=, stack_end=0x7ffffb4542b8) at ../csu/libc-start.c:360
#22 0x0000000000657925 in _start ()
I haven’t tested the performance impact of this at all, but since the Python code interpretation is slow anyway, your performance critical tight loops are (hopefully) not using pure Python code, but compiled libraries like Polars (or DuckDB!). An occasional non-conditional trampoline jump and back within all the complexity of Python interpretation code should not cause a noticeable problem. I’m too busy myself right now, so if you publish some comparison benchmarks, let me know and I can include links to it.
Notes
- Currently it looks like every Python program run creates a separate
/tmp/perf-PID.mapfile, which is expected by design, but nothing removes the files later on. So you might have to keep an eye on your /tmp directory and remove old files if you execute many short-lived Python programs like that. - You might wonder if Python (CPython implementation) is now capable of JIT-ing its code - the CPython JIT PEP 2 shows there’s some work done in this space. I guess that this trampoline trick uses some of that code under the hood.
- Peter McConnell wrote about this feature back in 2022 already, including examples of generating FlameGraphs from the Perf/Python samples 3.